Shortlink for this page: http://wp.me/P7y4l-8nz (suitable for blog or Twitter comments)
Near real-time solar Activity:
| Current solar status:
|
Geomagnetic conditions:
|

Solar Dynamics Observatory HMI Continuum – other image sizes: 4096 2048 1024 – Movie: 48 hr MPEG (color) |
|
|
HMI Magnetogram: 4096 2048 1024 48 hr MPEG movie |
AIA 193Å Other sizes: 4096 2048 1024 48 hr MPEG movie |
Other SDO (Solar Dynamics Observatory) imagery
Recent still images from the AIA (Atmospheric Imaging Assembly) and HMI (Helioseismic and Magnetic Imager).
Latest full field movies in one browser window (for high bandwidth connections):

STEREO (Solar Terrestrial Relations Observatory):
STAR Coronal Hole and Active Region Map – Solin.info – Jan Alvestad
 |
Solar Wind:
Satellite Environment Plot


Geomagnetic Activity Chart – MAGNE KA – Kakioka Geomagnetic Observatory – GFZ – Helmoltz Centre – Potsdam – Click Here
ACE RTSW (Estimated) Magnetic Field & Solar Wind

X-Rays plot:

EVE Soft X-Ray
Aurora Plots
The OVATION Prime Real-Time (OPRT) tool is a real-time forecast and nowcast model of auroral power and is a prototype implementation of the work by Newell et al (2009). OPRT is run every 5 minutes and the web display automatically refreshes. The model output below represents hemispheric power in Geomagnetic coordinates, oriented with local noon at the top. Thus, the top half of each polar plot represents magnetic longitudes in daylight and the bottom half represents longitudes in darkness.
| North Nowcast |

North Forecast
|
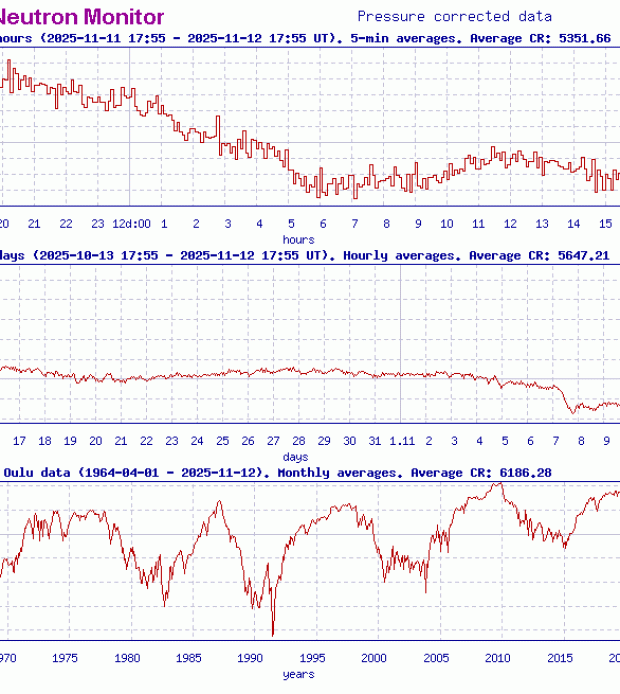
Neutron Monitor Count Graphs:
University of Delaware, Bartol Research Institute, Neutron Monitor Program
 |
 |
 |
 |
 |
 |

Total Solar Irradiance (TSI)
34 years – Instrument offsets are unresolved calibration differences, much of which are due to internal instrument scatter (see Kopp & Lean 2011).

Total Solar Irradiance (TSI) – Daily Average Full SORCE Mission- 2003 – Present

Total Solar Irradiance (TSI) -F10.7-MF-SSN-Solar Activity Plot:

Apparent Atmospheric Transmission of Solar Radiation at Mauna Loa, Hawaii

Recent Solar Activity Plots (updated daily):

Leif Svalgaard – Active Region Count: (updated weekly)


Daily Sunspot Area – “Butterfly” Diagram

NICT (Japan) plot of lat/lon of sunspots and flares on the solar disk:
![]()
NOAA Space Weather Prediction Center Plots (updated monthly):


![[Graph Here]](https://i0.wp.com/hirweb.nict.go.jp/picture/legend.gif?resize=968%2C50)
Magnetic Field:
Solar Polar Fields – Mt. Wilson and Wilcox Combined -1966 to Present

Solar Polar Field – Wilcox Solar Observatory (WSO) – 1976 to Present

To view the Northern Solar Polar Field only – Click Here
To view the Southern Solar Polar Field only – Click Here
Solar Polar Fields – Wilcox Solar Observatory (WSO) – 2003 to Present

Livingston & Penn Umbral Intensity and Magnetic Field

Cosmic Rays
Oulu Neutron Monitor

Newark, DE Neutron Monitor

McMurdo Neutron Monitor

Thule Neutron Monitor

Fort Smith Neutron Monitor

Inuvik Neutron Monitor

Source Guide
Geophysical Institute – University of Alaska – Fairbanks
Home Page – http://gse.gi.alaska.edu/
Recent Solar Weather Predictions – http://gse.gi.alaska.edu/recent/
FTP Page – http://gse.gi.alaska.edu/recent/archive/
GFZ – Helmoltz Centre – Potsdam
Home Page – http://www-app3.gfz-potsdam.de/kp_index/index.html
Kp Index – http://www-app3.gfz-potsdam.de/kp_index/quicklook.html
Kp Index Background – http://www-app3.gfz-potsdam.de/kp_index/description.html
FTP Page – ftp://ftp.gfz-potsdam.de/
Home Page – http://www.leif.org/research/
National Institute of Information and Communications Technology (NICT)
Home Page – http://www.nict.go.jp/index.html
Data & Products Page – http://hirweb.nict.go.jp/
Space Weather Forecast Page – http://www2.nict.go.jp/y/y223/sw_portal/sw_portal-e.html
Solar Wind Simulations – http://www2.nict.go.jp/y/y223/simulation/ionos/sun/index.html
Magnetosphere Simulations – http://www2.nict.go.jp/y/y223/simulation/realtime/home.html
Magnetosphere Animations Back to 2006 – http://www2.nict.go.jp/y/y223/simulation/realtime/movie.html
Ionosphere-Thermosphere Simulation – http://www2.nict.go.jp/y/y223/simulation/ion/index.html
National Oceanic and Atmospheric Administration (NOAA) – Earth System Research Laboratory (ESRL)
Home Page – http://www.esrl.noaa.gov/
Physical Sciences Division (PSD) Products Page – http://www.esrl.noaa.gov/psd/products/
Physical Sciences Division (PSD) Data Data Page – http://www.esrl.noaa.gov/psd/data/
Physical Sciences Division (PSD) Data Maps Page – http://www.esrl.noaa.gov/psd/map/
National Oceanic & Atmospheric Administration (NOAA) – National Geophysical Data Center
Home Page – http://www.ngdc.noaa.gov/
Geomagnetism Page – http://www.ngdc.noaa.gov/geomag/geomag.shtml
Geomagnetic Poles Location – http://www.ngdc.noaa.gov/geomag/GeomagneticPoles.shtml
Space Weather Page – http://www.ngdc.noaa.gov/stp/spaceweather.html/
Ovation Aurora page – http://www.ngdc.noaa.gov/stp/ovation_prime/
FTP Page – ftp://ftp.ngdc.noaa.gov/
National Oceanic & Atmospheric Administration (NOAA) – Space Weather Prediction Center
Home Page – http://www.swpc.noaa.gov/pmap/index.html
Space Weather Now – http://www.swpc.noaa.gov/SWN/index.html
Energetic Particles – http://www.swpc.noaa.gov/tiger/
Auroral Activity – http://www.swpc.noaa.gov/pmap/index.html
Real-time Monitor Displays – http://www.swpc.noaa.gov/rt_plots/
FTP Page – http://www.swpc.noaa.gov/ftpdir/
University of Delaware – Bartol Research Institute – Neutron Monitor Program
Home Page – http://neutronm.bartol.udel.edu/
University of Oulu – Sodankyla Geophysical Observatory
Home Page – http://www.oulu.fi/english/
Cosmic Ray Station – http://cosmicrays.oulu.fi/
Solen.info – Jan Alvestad
Home Page – http://www.solen.info/solar/
Archive of Solar Activity Reports – http://www.solen.info/solar/old_reports/
SORCE Solar Radiation & Climate Experiment – The University of Colorado at Boulder – NASA
Home Page – http://lasp.colorado.edu/sorce/index.htm
Total Solar Irradiance (TSI) Page – http://lasp.colorado.edu/sorce/data/tsi_data.htm
Solar Spectral Irradiance (SSI) Page http://lasp.colorado.edu/sorce/data/ssi_data.htm


You must be logged in to post a comment.