A Thought Experiment; Simplifying the Climate Riddle.

Foreword: Climate sensitivity is the central point of all climate change arguments, yet it is still undefined. As we point out in our Everything Climate reference page:

Declaring future predictions of global warming “settled science” requires a fairly precise calculation of future temperatures. However, since climate sensitivity was first identified more than 40 years ago, scientists and climate models have produced a very broad range of potential future temperature patterns. Calculations for a doubling of atmospheric carbon dioxide range from 0.8°C warming to 6.0°C future warming by 2100.

So, this thought experiment, a genre Einstein was so fond of, really isn’t any better than any of those guesses. Channeling Kevin Trenberth we can say this: “The fact is that we can’t account for the lack of a known climate sensitivity value at the moment and it is a travesty that we can’t.” – Anthony


By Bob Irvine

Is it possible to simplify the climate sensitivity debate? Einstein was famous for solving the most difficult problems on the back of an old envelope. Without pretending to be in the same league as the great man, is it possible to follow his example, take a sharp pencil and on the back of an old envelope write the following words.

“There are only two things that contribute to the energy content of a body or system. They are input energy and energy residence time within that system.” (David’s Law, Thanks David)

All the complex changes to energy pathways, changes of state and movement of molecules can be summarised and simplified with these words. They give us a base from which important conclusions can be drawn.

If there were room on the back of that envelope, we might also write the corollary,

“It follows that a positive-feedback to any increase in system energy content from any cause will, by definition, further increase the residence time of that energy within the system while a negative-feedback will effectively reduce that residence time.”

There is, of course, nothing controversial about these statements. We put a jacket on, and our body heat is retained for longer. We warm up.

Solar radiation better penetrates a matt black steel ball and consequently remains within the ball for longer than it would in a shiny and reflective silver steel ball. It is understood that no reflection is perfect, and also understood that energy residence time determines that the temperature at the centre of the black ball will be higher assuming similar solar input energy. (See Note B)

HOW DOES THIS APPLY TO THE CLIMATE SENSITIVITY DEBATE?

Essentially, the Green House gases (GHG) absorb and reemit a small fraction of long wave radiation that would otherwise have found its way to space more quickly. GHGs increase energy residence time as discussed above and consequently warm the global surface.

Equilibrium is still eventually reached at the Top of the Atmosphere (TOA) but this equilibrium takes a little longer. Hansen (2) “..show analytically, with ocean mixing approximated as a diffusive process, that the response time (TOA) increases as the square of climate sensitivity.”

None of the statements so far are controversial in any way. These are now followed by another uncontroversial statement. Energy reemitted by CO2 sometimes strikes the ocean surface and is almost totally absorbed within the first 0.015mm and within the evaporation layer of that ocean surface and from there is returned very quickly to the atmosphere and space as latent heat of evaporation. Consequently, equilibrium at the TOA is restored relatively quickly.

An uncontroversial consequence of all this is that energy reemitted by CO2 will, on average, act somewhere in the atmosphere while short wave solar energy will, on average, act at a depth of some meters below the ocean surface. This is a physical consequence of the different wave lengths involved and is not disputed.

The agreed forcing for a doubling of CO2 is approximately 3.7 w/m^2 at the surface. A similar solar forcing increase of 3.7 w/m^2 would, on the other hand, be absorbed on average a number of meters below the ocean surface. Although it is not a gas, water has a much stronger greenhouse effect than do the GHGs. By the time that solar energy on average reaches the surface it has been delayed significantly, all the time adding to its residence time in the system.

The whole GHG debate relates to surface temperature as it effects our day-to-day activities at the global surface. A 3.7w/m^2 increase in solar forcing will have a much bigger effect on surface temperature than a similar 3.7w/m^2 increase in CO2 forcing that, on average, acts in the atmosphere. As noted, equilibrium will still be restored at the TOA but will simply take longer for an equivalent solar forcing.

Or to put it another way, the consensus is that a doubling of CO2 is consistent with a forcing increase of about 3.7 w/m^2 and, by calculation, a surface temperature increase of about 1.2C before the atmospheric feedback has acted.

A 3.7 w/m^2 change in solar forcing, on the other hand, would already have been subject to significant delay and consequently strong positive ocean feedback by the time it on average caused a surface temperature change.  That surface temperature change would then be subject to various atmospheric feedback and could conceivably be up to 10C or more (my best guess is about 5.2C with significant error bars) at equilibrium, and consequently should change our approach to all reality-based Equilibrium Climate Sensitivity (ECS) studies as they apply to GHG forcing.

I define ECS here as the surface temperature change after an extra 3.7 w/m^2 (CO2 doubling equivalent) of any type of forcing has been applied and the climate system is allowed to attain equilibrium. The point being made here is that ECS at the global surface will be higher for an incremental change in solar forcing than it would be for a similar sized change in CO2 forcing.

CONCLUSION

Nothing written in this essay to date is controversial except my ECS surface temperature guess of 5.2C (approx.) for a 3.7w/m^2 increase in solar forcing. (See Note C) I am proposing here a solar ECS of about 5.2C and a CO2 ECS of about 1.3C because, when applied in tandem, they reproduce with surprising accuracy our best estimates of global surface temperatures for the last century and millennium. They are a guide only but do have a physical basis that is relatively uncontroversial.

Note A; It is important to note here that an incremental change in solar forcing is generally believed to have the same warming affect at the global surface as does a similar change in CO2 forcing. General opinion, including that of the IPCC and many sceptics, concedes that the oceans will delay that temperature change at the surface for solar forcing but maintains that the surface temperature change will still eventually be approximately the same. This essay argues that not only will the oceans delay that temperature change but that they will also enhance that change as a result of that delay. This point or mechanism is well described by Forster (1) in the following quote;

“Imagine, for example, that the atmosphere alone (perhaps through some cloud change unrelated to any surface temperature response) quickly responds to a large Radiative Forcing to restore the flux imbalance at the TOA (Top Of Atmosphere), yielding a small effective climate forcing.  In this case the ocean would never get a chance to respond to the initial Radiative Forcing, so the resulting climate response would be small, and this would be consistent with our diagnosed “Effective Climate Forcing” rather than the conventional “Radiative Forcing.”

Note B; A slightly more detailed analysis of the black ball/reflective silver ball example might be that, while the temperature in the centre of the two balls differs, the surface of the two balls are actually the same temperature. The surface of the black ball only feels hotter due to higher conductivity. In the Earth’s case, the surface of the globe or ball is the average emission height, and this also stays at the same approximate temperature after a forcing increase, while the temperature in the interior and importantly, on the surface where we live, is warmed by increased energy residence time.

Note C; It is, of course, quite possible that my estimated global average of 5.2C for solar ECS due to increased relative residence time is too high, the difference being made up with various solar multipliers and or other feedback in an extremely complex and chaotic climate system.

Note D; The consensus argument that CO2 atmospheric warming will act as a blanket and consequently slow ocean cooling is not being disputed here. This insulation affect is insignificant when compared to the fact that solar energy is absorbed, on average, meters below the ocean surface and in this way is overwhelmingly responsible for the temperature profile of the earth’s oceans.

Note E; In support, changing radiative penetration has been shown to have a significant effect on Ocean Heat Content. For example, radiative transfer is significantly affected by oceanic pigment as discussed by Gordon [3] and Morel [4]. Ohlmann [5] showed that the heating rate of a 20-meter mixed layer can be changed by about 0.33°C per month by a solar radiative penetration that can reach 40w/m2 in the tropical ocean. Siegel [6] concluded that a 10 w/m2 change in penetrative solar flux at 20 meters can result from a 0.10 mgm-3 change in phytoplankton concentration.

Forcing efficacy is discussed here;

http://www.witpress.com/Secure/elibrary/papers/HT14/HT14024FU1.pdf 

REFERENCES

  1. Forster, P.M.F., & Taylor, K.E., – Climate Forcings and Climate sensitivities Diagnosed from Climate Model Integrations Coupled.  Journal of Climate, 6183, 2006.
  2. Hansen, J., Sato, M., Kharecha, P., von Schuckmann, K., – Earth’s Energy Imbalance & Implications.  Atmos. Chem. Phys. Discuss, 11, 27031-27105, pp 19-21, 2011.
  3.  Gordon, H.R., & Morel, A., – Remote assessment of ocean color for interpretation of satellite visible imagery, – A review. Spring–Verlag. 114pp, 1983.
  4. Morel, A., – Optical modelling of the upper ocean in relation to it’s biogenous matter content (case 1 waters). – J. Geophys. Res., 93. 10749-10768. 1988.
  5. Ohlmann, J.C., Siegel, D.A. & Gautier, C., – Ocean mixed layer radiant heating and solar penetration. A global analysis. J. Climate. 9, 2265-2280. 1996.
  6. Siegel, D.A., Ohlmann, J.C., Washburn, L., Bidigare, R.R., Nosse, C., Field, E. & Zhou, Y. – Solar radiation, phytoplankton pigments, and radiant heating of the equatorial pacific warm pool. – J. Geophys. Res., 100, 4885-4891. 1995.
3.8 16 votes
Article Rating
Subscribe
Notify of
199 Comments
Oldest
Newest Most Voted
Inline Feedbacks
View all comments
dk_
December 20, 2023 10:39 pm

because, when applied in tandem, they reproduce with surprising accuracy our best estimates of global surface temperatures for the last century and millennium.

Confirmation bias?

Bob Irvine
Reply to  dk_
December 20, 2023 11:37 pm

dk
How do you think every other reality based sensitivity estimate is arrived at?

DMacKenzie
Reply to  Bob Irvine
December 21, 2023 9:02 am

Good food for thought, Bob. I think it makes some sense in that net IR at surface is about 50 watts upward and surface solar is about 160 watts so a ratio of about 3…so if you use a CO2 ECS of 1.3 solar will be a similar multiple depending on whether you use insolation, TOA, below cloud, etc. for your solar variation. The T^4 Planck effect through the atmospheric window probably doesn’t allow one to take this as far as 5.2 degrees, but my old HP-41doesn’t work until I’ve had my morning coffee.

Bob Irvine
Reply to  DMacKenzie
December 21, 2023 6:28 pm

Just drinking my coffee now so I’m still a bit unreliable. Your multiple of 3 may be better than my estimate.
I only chose 4 because I could better create the NOAA 20 th century temp and the last millennium.
The NOAA temp may be wildly inaccurate so you may well be correct

Editor
Reply to  dk_
December 21, 2023 12:48 am

That’s not confirmation bias, it’s probably the most unbiased and sensible way to check the estimates. It’s hard to think of a less cherry-picking-like way of checking.

dk_
Reply to  Mike Jonas
December 21, 2023 2:32 am

Then it isn’t cirucular reasoning to state that the historical estimates of surface temperature that we use to calculate ECS can be used to validate our estimates of ECS?

they reproduce with surprising accuracy our best estimates of global surface temperatures for the last century and millennium

Tom Abbott
Reply to  dk_
December 21, 2023 3:21 am

From the article: “I am proposing here a solar ECS of about 5.2C and a CO2 ECS of about 1.3C because, when applied in tandem, they reproduce with surprising accuracy our best estimates of global surface temperatures for the last century and millennium.”

What are you talking about here with “our best estimates of global surface temperatures”? The bogus Hockey Stick chart?

I hope you are not basing anything on a Hockey Stick chart because Hockey Stick charts don’t represent reality.

dk_
Reply to  Tom Abbott
December 21, 2023 9:00 am

Tom,
Exactly whose post are you objecting to, mine (which twice quote the same line as you do) or the author’s?
I never said anything about a hockey stick. Maybe the good Mr. Irvine does, I can’t tell.
Einstein engaged in reasoning by analogy in order to check for illogic. I’m asking if this line in the source article isn’t evidence of illogic.

Tom Abbott
Reply to  dk_
December 22, 2023 2:56 am

dk_, I wrote: “From the article:”.

I was commenting on what was said in the article, not what you wrote.

I probably should have not placed my comment under yours. 🙂

dk_
Reply to  Tom Abbott
December 22, 2023 11:21 am

Tom,
I think we agreed, then. But I didn’t realize at the time that the author agreed, too.
Still struggling with what Bob Irvine was trying fo accomplish here. Guess I’m not the only one.

Tom Abbott
Reply to  dk_
December 24, 2023 3:11 am

Yes, I was actually supporting your comments, which is why I put the post in this place.

Richard Greene
Reply to  dk_
December 21, 2023 3:24 am

It’s far worse than just a circular reasoning logical fallacy. It is a methodology that can not be used to estimate or verify an ECS of CO2 guess.

There is no global average temperature for the 1800s. There were very few measurements outside the N.H. and even there mainly in ocean shipping lanes. The data are far from being global , with more infilling than actual measurements.

Potential accuracy begins in 1979 with satellites, and even then the numbers can be adjusted to be “popular” (RSS)

But even if we had VERY accurate global average temperatures since 1850, we would still have no idea what percentage of the warming since 1850 was caused by CO2. The ECS of CO2 would be still impossible to know.

But with such accurate measurements, that do not exist, a rough worst case ECS of CO2 estimate could be calculated by assuming all the warming after 1850 had been caused by manmade CO2 emissions.

But then the 1850 CO2 level is just a guess, not measured.

The bottom line is historical temperature statistics do NOT give us a methodology for an ECS of CO2 estimate.

The author’s statement was:
“when (my ECS guesses are) applied in tandem, they reproduce with surprising accuracy our best estimates of global surface temperatures for the last century and millennium.”

This is worse than just the obvious circular reasoning. In the past few thousand years the ONLY global warming observations that could be blamed on CO2 were after 1975, with a +27% increase of CO2 through 2023. The +7% estimated increaser of CO2 from 1940 to 1975 was accompanied by global cooling. Prior to 1940 manmade CO2 emissions were almost irrelevant for the warming trend since the 1690s.

The +27% increase of CO2 from 1975 to 2023 was manmade

The average temperature increase was about +0.7 degrees C. depending on whose statistics you believe.

There is no way to determine the percentage of the +0.7 degrees C. warming that was caused by the +27% CO2 level increase/

Therefore, historical temperature data, no matter how accurate, can NOT be used to calculate or verify an ECS of CO2 guess.

The Honest Climate Science and Energy Blog

Scissor
Reply to  Richard Greene
December 21, 2023 4:12 am

Good synopsis.

On the other side, one variable affects everything, it rules, so says Jane Fonda.

Richard Greene
Reply to  Scissor
December 21, 2023 8:42 am

It is possible that all warming since 1975 was manmade, from:

CO2 emissions

Reduced SO2 emissions

Land use changes

UHI increasing

Inaccurate global average temperature measurements and/or global average statistics

All those could explain 100% of the warming since 1975

But there is evidence of more sunlight being absorbed by the ground from changes of cloudiness in addition to lower SO2 emissions and increasing UHI

After 4.5 billion years of ONLY natural climate changes, you can’t declare that natural climate changes stopped or are just
noise” as the IPCC arbitrarily declared in 1995. That’s junk science to support a political agenda … which appears to be the entire purpose of the IPCC/

Editor
Reply to  Richard Greene
December 21, 2023 10:19 am

I disagree. This is an entirely different approach to anything the IPCC has done. For starters, it distinguishes between wavelengths, which the IPCC crowd do not. Secondly, it is primarily not about CO2 but about sunlight. Thirdly, it doesn’t introduce spurious feedbacks. Considerations of CO2 flow only from the sunlight analysis and the difference between sunlight and CO2. This should have been in the IPCC analysis from the start, and then we wouldn’t have any of the garbage we have to contend with now.

Tom Abbott
Reply to  Richard Greene
December 22, 2023 3:03 am

Excellent comments, Richard! Right on the money.

Editor
Reply to  dk_
December 21, 2023 10:12 am

Using historical temperatures to check estimates of the effect of radiation based on the physics of the ocean surface is OK. Using historical temperatures to check estimates based on historical temperatures is circular.

dk_
Reply to  Mike Jonas
December 21, 2023 11:15 am

Mike,

Thanks, I think so, too.

But then I would question that paragraph opening statement beginning “Nothing written in this essay to date is controversial except my ECS surface temperature guess…” Since those “historical” data guesses are certainly contested, as our friends Messrs Abbott and Greene seem to support

The assumption, that those data were generally accepted, led to my question if Mr Irvine’s conclusion (too often quoted in this thread already) indicate confirmation bias. I’m still not convinced that it does not, but I accept that you assert that it doesn’t.

It wasn’t the only assumption that I question in this text, others seem to have jumped on most of them.

Rich Davis
Reply to  dk_
December 21, 2023 1:12 pm

Dk I think you’re misinterpreting the word “estimates”. The author is (I believe) referring to our best reconstruction of historical global temperatures. He doesn’t mean our best guess from a model begging the question of what ECS is. He means trying to estimate what the trend of global average temperature anomaly has been despite sparse data.

dk_
Reply to  Rich Davis
December 21, 2023 3:15 pm

Rich,

I don’t believe that is correct. I visited the linked 2014 article:

A comparison of the efficacy of green house gas forcing and solar forcing
R.A. Irvine
SRG Industries, Queensland, Australia

https://www.witpress.com/Secure/elibrary/papers/HT14/HT14024FU1.pdf

Revised version received 21st June 2015

A crude forcings model has been developed that matches almost perfectly (R2=0.89) the National Oceanic and Atmospheric Administration (NOAA) temperature series from 1880 to 2010.”

The forcing model has an R2 of 0.89 suggesting a significantly better fit than the HadGEM2 CMIP5 model which has an R2 of 0.16. The model (Figure 1) accurately reproduces the slope of the temperature rise from 1910 to 1940, the cooling from 1940 to 1970, the slope of the temperature rise from 1970 to 1998 and the temperature hiatus of the last decade or more.

Appendix 2 gives the inputs to the Irving models, describing the NOAA series, above, with derived values for GHG and Solar radiation.

Appendix 3 tells how the values above were derived. In part:

The history of GHG forcing since 1880 was calculated as follows.- A preindustrial CO2 concentration of 280ppm was assumed. CO2 concentrations since 1880 were taken from the IPCC pre 1960 and from Mauna Loa after 1960.”

IMO the author’s description of a system model is based entirely on CIMP5 and NOAA’s temperature series. NOAA’s temperature series is surely controversial in some venues, but is absolutely used by the author as a model input.

As far as CIMP5 is concerned, in 2019 Dr. Roy Spencer detailed ongoing controversy between CIMP5 and the observed record since 1979.

https://wattsupwiththat.com/2019/12/13/cmip5-model-atmospheric-warming-1979-2018-some-comparisons-to-observations/
CMIP5 Model Atmospheric Warming 1979-2018: Some Comparisons to Observations

Dr. Spencer concludes

Finally, one should keep in mind that individual climate models still have their warming rates adjusted in a rather ad hoc fashion through their assumed history of anthropogenic aerosol forcing, which is very uncertain and potentially large OR small.

Perhaps I am cherry picking, but I don’t think so. The notes extracted from the 2014 paper seemed to me to be summary. Read it yourself, and don’t use my link but the author’s.

I submit that using a estimated time series from a limited number of unreliable samples for the entire earth with an unverifiable greenhouse gas model as input to achieve a similar output isn’t simplifying anything, or even a thought experiment. Repeating several times that the claims in the essay are not controversial is misleading, designed to avoid explanation and defer question, not to validate the claims. The reasoning seems as circular, to me, as is the timeworn formula “Garbage In – Garbage Out.”

Bob Irvine
Reply to  dk_
December 21, 2023 6:14 pm

dk
I agree that the temperature series used are garbage but they were all I had. I personally think they exaggerate the 20th century warming. If that is the case then my CO2 ECS is too high and will likely be less then. 1C.
This is of course a side distraction and not real relevant to the post other than by pointing out the failure of all other EBM models. Whatever temperature series you come up with can be reproduced only if the Efficacy of solar forcing is significantly higher the CO2 efficacy.
This should completely change our approach to developing climate sensitivity estimates.
The point of my post and backed by solid physics

dk_
Reply to  Bob Irvine
December 21, 2023 10:08 pm

Bob,
I admit I’m still struggling with it all. For instance, your statement
“There are only two things that contribute to the energy content of a body or system. They are input energy and energy residence time within that system.” (David’s Law, Thanks David)

…seems to be a conflation of at least two of the laws of thermodynamics:
1st and 2nd laws courtesy Wikipedia:[links removed]

The first law of thermodynamics states that, when energy passes into or out of a system (as work, heat, or matter), the system’s internal energy changes in accordance with the law of conservation of energy.

The second law of thermodynamics states that in a natural thermodynamic process, the sum of the entropies of the interacting thermodynamic systems never decreases. A common corollary of the statement is that heat does not spontaneously pass from a colder body to a warmer body.

I guess my confusion, other than the name you give for it, is based on your inclusion of a time factor for “energy residence” in a body. I’d thought that “energy changes IAW the law of conservation of energy” and “entropies never decrease” in laws 1& 2 covered that, and any factor of delay in the process must come be contained in the conservation of energy.

I tried to look up “David’s Law” and only found reference to U.S. House of Representatives HR-68, which seems to be concerned with cyber bullying.

I won’t paste in your corollary, but not understanding your use of “Dave’s Law,” I can’t follow to your second statement.

I admit that from there I was drawn to the apparent circular reasoning in the conclusion — which is where I asked the original question.

Maybe you can help me to understand why we need Dave’s Law to understand your thesis? Can it be stated in terms of thermodynamics?

Bob Irvine
Reply to  dk_
December 22, 2023 3:24 pm

dk
Thanks for the detailed response.
There are from memory about 21 distinct climate zones and each of these will have different climate response to any change in energy forcing.
These different responses in general relate to the time needed for equilibrium to be restored at the TOA. This will change depending on the physical characteristics encountered by the energy forcing.
The IPCC applies a lower efficacy to a forcing that acts higher in the atmosphere. TOA equilibrium is restored quickly.
They attribute a higher efficacy to a forcing that acts on the polar regions because that slows energy transfer from the tropics and equilibrium is delayed.
These forcing efficacy changes also apply to small areas. For example water pigment changes have an effect as discussed in the post.
All this complexity can be understood as changes in the residence time of energy within a system.
This may be a leap but needs to be taken into account when trying to estimate sensitivities.
It should be one of the main considerations and is completely consistent with all thermodynamic laws.

dk_
Reply to  Bob Irvine
December 23, 2023 7:18 am

Bob,

I think I agree. But after the statement.

GHGs increase energy residence time as discussed above and consequently warm the global surface.

Your essay seems to first emphasize, but then discard time as a factor, and never characterizes how long the additional energy remains in the system, even in the abstract.

This is reinforced, my impression, by repeated reference to GHGs or CO2 as insulators, directly and by analogy (“jacket” reference). The hypothetical observer must watch his stopwatch and simultneously sense the sytsem total energy in order to determine how much energy is in the system.

The first and second laws don’t require consideration of time. Put much more simply (than e.g. David’s Law)(my formulation): “The energy of a system is the starting state, plus the energy added, minus the energy removed from the system.”

Treating GHG and/or CO2 as both a source of increased radiation and an insulator makes the dynamics of the system more complex and harder to imagine, IMO not simpler.

Similarly, the black body analogy is useful, but how important is it when the body is also simultaneously energy into space with the energy input?

The clasic black body imagines energy absorbed into the system uniformly from all directions. But the earth receives maximum radiation input near the equator, at noon, then less so across all lit surfaces, then radiates that energy away at night as it rotates, and over several different material regimes (not a uniform material or shape). GHGs receive energy mostly from the direction of the sun, but re-emit that energy in all directions, and not much of that to the surface. In darkness, GHG/CO2 continue to receive radiation from the rest of the system, and re-radiate them in all directions — not much of that to the surface. The differences in energy and rotation (and tilt, and distance, and tidal forces) create energy and material flows, transferring it from hot to cold, and radiating it into space.

Insulation is a property of either a vaccuum or of materials that do not transfer heat quickly. If a material is flowing it is transferring energy and not storing it.

Again, from your essay,

[Water] is not a gas, [but] has a much stronger greenhouse effect than do the GHGs.

But water vapor is treated as a gas, and conducts heat from the surface to the stratosphere. Condensing, or condensed, frozen water is also a reflector of energy, reflecting energy back into space. Phase change of water from gas to liquid, liquid to ice, ice to liquid uses energy — still in the system (Law 2) but “moved.”

I don’t think that you mean that energy only flows into the oceans and remains there in stasis. It cools off, at least from dusk to dawn and everywhere at the surface where the temperature is less than that of the air.

The analogy for GHG variation in evaporation, as you illustrated in your 2014 experiments, actually demostrates an increase of the radiation of heat from the ocean through increase of the volume of water vapor exchange of heat into the upper atmosphere – the hydrologic cycle. The effects include cooling of the water surface from evaporation, and cooling the surface from condensed water returning to (or near to) the surface.

Increasing ocean heat increases ocean and atmospheric flows from the tropics to the poles, increases radiation into space, and doesn’t do so evenly because of the geography, rotation, seasonal incline, and a host of other factors.

In considering a time factor to the influx of energy, as in David’s Law, are you trying characterize thermal storage without loss? Doesn’t this add, but not address, complexity?

How do we evaluate or measure the change (if any) of energy loss from the system over time? Doesn’t that add complexity?

How do we charactarize the effect of changing flow of energy within the sytstem? Do we assume that added energy does not affect transfer? Do we assume that delta in does not affect delta out?

How do we characterize the rate of energy loss by GHG/CO2 from the system (in can’t all only flow to the surface)? Do they continue to force energy gains to the system in the absence of sunlight?

Is it a simplification to ignore complexity?

Bob Irvine
Reply to  dk_
December 23, 2023 5:18 pm

dk
My language has obviously confused the issue.
The jacket reference was only meant to illustrate the point about residence time.
”Is it a simplification to ignore complexity?”
In this case we have a completely different mechanism to separate solar and CO2 forcing efficacy. It is completely ignored by the IPCC despite the physics behind it being uncontroversial.
Its a simplification in that we don’t have to argue complex cosmic ray theories or jet stream changes etc to explain the strong solar influence on climate. Doesn’t mean these and other ideas aren’t relevant.
W/M2 do not always have the same impact on Earths temperature, in fact they probably never have the same impact in a complex system like the Earths physical environment and climate.
I’ll go one step further and defy anyone to make an Energy Balance Model that matches the last century and millennium without giving solar forcing a much higher efficacy than CO2 forcing.

Thanks for the thoughtful questions

Tom Abbott
Reply to  Bob Irvine
December 22, 2023 3:27 am

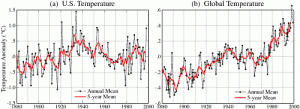
Bob, try your estimation on the Hansen 1999 chart.

That is the chart that represents the real temperature profile of the planet.

The Hansen 1999 chart is the least bastardized U.S. chart that can be found. After the cooling began in 1999, the climate alarmist decided they needed to “adjust” the temperature profile to fit their climate alarmist narrative. So 1999 is the best we can do from the official record. After that, the official records have been bastardized all to hell.

Try it out. See what your ECS estimation is then, using Hansen 1999. I am real curious to know that number.

Tom Abbott
Reply to  Tom Abbott
December 22, 2023 3:40 am

Here is Hansen 1999:

comment image

Tom Abbott
Reply to  dk_
December 22, 2023 3:17 am

“The forcing model has an R2 of 0.89 suggesting a significantly better fit than the HadGEM2 CMIP5 model which has an R2 of 0.16. The model (Figure 1) accurately reproduces the slope of the temperature rise from 1910 to 1940, the cooling from 1940 to 1970, the slope of the temperature rise from 1970 to 1998 and the temperature hiatus of the last decade or more.”

Below is a comparison of the bogus, bastardized Hockey Stick chart (on the right) next to a U.S. regional surface temperature chart (Hansen 1999), on the left.

The claim above is that the bogus Hockey Stick chart matches the fit of his estimation of ECS, yet if that’s the case, then his fit does not match the U.S. surface temperature chart because the temperature profiles of the two charts are completely different.

The U.S. chart shows cyclical cooling and warming equivalent to a 2.0C range, whereas the bogus Hockey Stick chart shows the temperatures getting hotter and hotter and hotter, for decade after decade, and shows we are now at the hottest time in human history.

One of those charts is wrong. The one this author uses to make his comparisons.

The author should try fitting his estimation of ECS to the U.S. temperature chart profile, which is the real temperature of the globe (no unprecedented warming).

Hansen-USchart-verses-Hockey Stick chart.gif
Bob Irvine
Reply to  Tom Abbott
December 22, 2023 3:31 pm

Tom
I agree that temperature histories have likely been manipulated.
From the Hansen graph it appears that CO2 would be a minor player with solar having a strong influence.
Estimating more accurate sensitivities from this graph would be time consuming but probably worth doing.

Tom Abbott
Reply to  Bob Irvine
December 24, 2023 3:13 am

“From the Hansen graph it appears that CO2 would be a minor player with solar having a strong influence.”

That’s what I’m thinking, too, Bob. 🙂

edim
December 20, 2023 10:47 pm

“Essentially, the Green House gases (GHG) absorb and reemit a small fraction of long wave radiation that would otherwise have found its way to space more quickly.”

Essentially, evaporation and convection at the surface do the same, transfer the heat to the atmosphere that would otherwise found its way to space more.

edim
Reply to  edim
December 20, 2023 10:51 pm

*more quickly

edim
Reply to  edim
December 20, 2023 11:06 pm

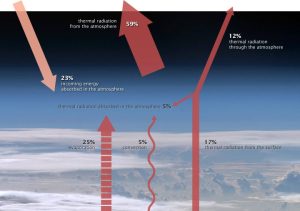
And this non-radiative heat transfer between the surface and the atmosphere ‘traps’ more heat (~85%) than the radiative heat transfer (~15%).

atmosphere_energy_balance (3).jpg
edim
Reply to  edim
December 20, 2023 11:14 pm

As the percentage of the total surface heat loss (including the direct radiation to space), it’s:
Non-radiative ~64%
Radiative ~11%
Not trapped ~25%

Petit-Barde
Reply to  edim
December 21, 2023 12:55 am

Just for information :

  • as you shurly know, radiative fluxes are not energy transfer
  • the energy transfer between 2 bodies is the difference between :
  • the radiative flux from body1 absorbed by body 2
  • minus the radiative flux from body2 absorbed by body1
  • the radiative energy transfer between the surface and the atmosphere is the difference between this 2 radiatives fluxes :
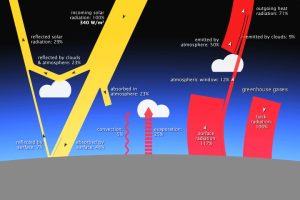
  • 1) from the surface and absorbed by the atmosphere (117-12 = 105%, see diagram below)
  • 2) from the atmosphere absorbed by the surface (100%)
  • Those values > 100% show that fluxes have no physical meaning (you can’t generate energy from nothing), but their differences have.
  • this difference is 5% (as shown in your diagram).
  • On the other hand, the radiative energy transfer between the atmosphere and the space is 59% (the space (4 Kelvin) -> atmosphere flux is neglected), if we don’t take clouds emission into account, the value is more or less 50% (see diagram below).
  • Thus the IR active gases globally cool the atmosphere mainly by dissipating energy into space (50%) from the middle tropophere (and up) and in this process, some energy is indeed absorbed in the lower tropopause (5%) : the cooling effect is about 45%.
  • The heat transfer between the lower and middle (up to the tropopause) troposphere is achieved by convection / advection cells.
Diagram_showing_the_Earth
edim
Reply to  Petit-Barde
December 21, 2023 2:48 am

Yes, that’s my point. That’s why I used the diagram that uses the radiative heat transfer s->a, not the individual radiative fluxes, to make the ‘thought experiment’ as simple (and clear) as possible. The so-called (natural) greenhouse effect is not only a radiative effect. It’s an insulative effect – the whole of the atmosphere (not just ‘ghg’ gases) provide resistance to heat flow.

Any estimate of ‘climate sensitivity’ without this understanding will be wrong.

Like R.W. Wood in his ‘Note on the Theory of the Greenhouse” noted:
“The solar rays penetrate the atmosphere, warm the ground which in turn warms the atmosphere by contact and by convection currents. The heat received is thus stored up in the atmosphere, remaining there on account of the very low radiating power of a gas. It seems to me very doubtful if the atmosphere is warmed to any great extent by absorbing the radiation from the ground, even under the most favourable conditions.”

From the modern observations:
On average, the atmosphere is warmed by absorbing the radiation from the ground to the extent of ~15%, by ‘contact and radiation currents’ from the ground ~85%. He was pretty much spot on.

edim
Reply to  edim
December 21, 2023 2:57 am

*convection currents, not radiation currents

Tom Abbott
Reply to  edim
December 21, 2023 3:26 am

“the whole of the atmosphere (not just ‘ghg’ gases) provide resistance to heat flow.

Any estimate of ‘climate sensitivity’ without this understanding will be wrong.”

Good point.

Steve Case
Reply to  edim
December 21, 2023 3:50 am

 It seems to me very doubtful if the atmosphere is warmed to any great extent by absorbing the radiation from the ground, even under the most favourable conditions.”
_________________________________________________

A search for the absorption spectrum of Nitrogen and Oxygen turns up only Oxygen with its small blip around 10μ. Apparently, Nitrogen is quite transparent. So 78% of the atmosphere isn’t going to warm up from radiation and another 21% isn’t going to warm very much. So water vapor and the other 1% have some heavy lifting to do.

Anyone who goes outside on a windy winter day without their mittens knows how fast your hands get very cold from contact with all that fast moving N2 and O2.

And a black body that radiates predominately at 15μ where CO2 absorbs has a temperature similar to a block of dry ice.

So when Dr. James Hansen says in Chapter 8 of the IPCC’s AR4 page 631 (pdf 43):

     “…the climate response to a doubling of
     atmospheric CO2 … with no feedbacks
     operating would be around 1.2°C”

do I believe that? Yes, I do. (-:

Petit-Barde
Reply to  Steve Case
December 21, 2023 6:55 am

This raises a question about the very ECS definition :

  • who knows what would be the conditions (temperatures, cloudiness, hygrometry, solar activity, volcanoes activity, cosmic rays, laps rate, global atmospheric circulation, etc.) in which the CO2 may double ?

Therefore :

  • who knows which parameters have to be fed to the models in order to compute an ECS estimation ?
  • And I don’t even speak about unknown parameters … for obvious reasons 🙂
Steve Case
Reply to  Petit-Barde
December 21, 2023 3:19 pm

“There are known knowns. 
These are things we know that we know. 
There are known unknowns. 
That is to say, there are things that we know we don’t know. 
But there are also unknown unknowns. 
There are things we don’t know we don’t know.” 
                                                  Donald Rumsfeld

Beta Blocker
Reply to  Steve Case
December 21, 2023 8:46 pm

Steve Case, we should note here that Donald Rumsfeld’s own personal experience clearly demonstrates that if we continue to breath air containing 420 ppm CO2, sooner or later, we will be dead.

Tim Gorman
Reply to  Steve Case
December 22, 2023 7:35 am

BINGO! (unless you are a climate scientist)

Tom Abbott
Reply to  Petit-Barde
December 24, 2023 3:22 am

Excellent questions.

What goes into figuring up an ECS?

It appears it can be different things to different people.

Not very definitive. Just like everything else concerning CO2 and its interaction with the Earth’s atmosphere.

People who claim the climate science is settled, don’t know what they are talking about. They don’t understand the science they claim is settled.

What a revolting development this is (Curly)!

Petit-Barde
Reply to  Petit-Barde
December 21, 2023 4:06 am

In my post, “some energy is indeed absorbed in the lower tropopause (5%)”
must be read :
“some energy is indeed absorbed in the lower troposphere (5%)

ferdberple
December 20, 2023 11:10 pm

Why is the effective radiating height of the earth’s atmosphere the same height as 500mb pressure about 5.5 km altitude?

500mb is the half mass of the atmosphere. Colder above warmer below.

The atmospheric lapse rate intersects this at -18C temperature, the temperature calculated for heating of the earth by the sun m.

Add the lapse rate of about 6 C per km and you get a surface temp of 15C

Unless someone can move the effective radiating height away from 500mb the earth’s temp is not going to change.

PCman999
Reply to  ferdberple
December 20, 2023 11:41 pm

I’ve wondered that too, and it’s also true for other planets with atmospheres, even CO2-greenhouse posterchild-planet Venus. The blackbody temp is reached at the altitude of center of mass of the atmosphere, also where the air pressure is half the surface pressure – without regard to the composition of the air. It’s like the atmosphere acts like a blackbody itself but the heat gets concentrated at the surface because of gravity.

I know in my engineer’s heart that CO2 absorbs and re-emits IR, but the evidence says it doesn’t act as global blanket.

bnice2000
Reply to  PCman999
December 21, 2023 10:48 am

 It’s like the atmosphere acts like a blackbody itself but the heat gets concentrated at the surface because of gravity.

Finally people are starting to see the reality !!

Rod Evans
Reply to  ferdberple
December 21, 2023 12:33 am

Now there is a question that Greta should be asked to explain and failing any comprehensible answer, maybe ask her teacher Al Gore to tell us.

Petit-Barde
Reply to  ferdberple
December 21, 2023 2:08 am

Indeed, one of the (many) AGW fallacies lies in the comparison of the theoretical earth’s surface (Z = 0 meter) emission (based on the wrongly applied Stefan’s law since the earth surface is not a black body and where there are other competing heat transfers as conduction, convection, evaporation/condensation) and the emission of the atmosphere as measured by satellites.
So we are comparing a theoretical emission at the surface (Z = 0 meter) to a measured atmospheric/ground emission which takes place at a mean altitude of 5100 meters (at a temperature of -18°C according to the Stefan’s law which may eventually apply when measuring the atmohphere/ground emission from the space).
The GHG hypothesis is based on the difference of this two values which it is supposed to explain.

This makes no sense :

  • for example, when we apply the Stefan’s law to the Sun, we calculate a 6000°C of temperature on the Sun’s “surface”, the photosphere which is the mean altitude from where most of the Sun’s photons are emitted into space,
  • for the same reason, the emission “surface” of the Earth is NOT the surface where we walk (Z = 0 meter), but the mean altitude from where photons are emitted into space.
  • All the diagrams where the measured atmopsheric emissions are compared to the theoretical emission of the Earth’s ground (by wrongly applying the Plank’s law) are therefore misleading, to say the least.
Tom Abbott
Reply to  Petit-Barde
December 21, 2023 3:32 am

I thought the science was settled. 🙂

ECS isn’t even settled, yet our politicians are ruining our economies because of it.

The Temperature Data Mannipulators are responsble for this.

Rich Davis
Reply to  Tom Abbott
December 21, 2023 1:31 pm

Politicians are not ruining our economy because of ECS. They are pretending to worry about ECS in order to ruin our economy.

Tom Abbott
Reply to  Rich Davis
December 24, 2023 3:27 am

They are using ECS as their vehicle to ruin the economy.

And they don’t even have the ECS nailed down. The estimate is between 1.5C and 4.5C! And they don’t have any idea where the real figure lands.

But, they are destroying our economies despite this.

It’s not about CO2 or ECS for a lot of them. It’s about power, and money and control.

Rich Davis
Reply to  ferdberple
December 21, 2023 1:27 pm

The height of 500 millibars varies with temperature. The atmosphere puffs out in the tropics and shrinks down at the poles. What does the lapse rate do when TOA is higher up and thus 500mb is higher up? If it remains the same, then the surface is hotter.

Martin Brumby
December 20, 2023 11:13 pm

I think it is possible to simplify this debate much more easily.
One side of the debate has always been happy to participate in genuine debate, examine factual evidence, compare alleged “projections” with real, measured outcomes.

The other side, enormously financed and privileged by incompetent politicians using taxpayers’ money and Billionaires with agendas, has lied, fiddled evidence on a massive scale, destroyed reputations, refused to discuss and blatantly pursues agendas to destroy the economies of the West.

Who are you inclined to believe?

Jeroen B.
Reply to  Martin Brumby
December 21, 2023 12:43 am

Neither of them. Please hear me out though.

The first side is perfectly happy to let me examine their data, explain me their reasoning so I can understand what they’re saying and doing.

The other side is forcing me to place faith in opaque studies that don’t add up once you reason through them; they appeal to authority and brook neither questioning nor debate nor doubt.

Since this entire debate has to be understood rather than believed I’ll believe neither, but I find it easier to understand the first and reject the other.

Joseph Zorzin
Reply to  Jeroen B.
December 21, 2023 3:10 am

so to simplify as much as possible, one side says the case is closed and the other says no way!

it’s always hard to have a debate in a situation like this

Jim Gorman
Reply to  Martin Brumby
December 22, 2023 4:57 am

Even worse. As more and more local and regional stations are being examined more closely, it is apparent there are a large number that have low or even no warming. One needs to explain how a well mixed gas, CO2, and a sun that traverses the earth every 24 hours like clockwork, can have such a variance in temperatures. The other thing that strikes me when animations are shown is how the hot areas migrate all around. Again, a well mixed CO2 and constant sun, how does this occur. If the GLOBE is warming, it should all be warming. Something is fishy!

ferdberple
December 20, 2023 11:19 pm

The small change in residency also applies to conduction and convection.

As the earth rotates the non ghg nitrogen absorbs heat energy fron the solar warmed surface which is carried into the sky. Then at.night as the surface cools convection and conduction return this energy stored in the nitrogen back to the surface

Since 80% of the atmosphere is nitrogen this approximately 12 hour increase in residency is the main driver of surface temperature.

Stephen Wilde
Reply to  ferdberple
December 21, 2023 12:42 am

Yes, see the articles on this site by me and Philip Mulholland. Convective overturning of atmospheric mass is the only cause of the enhanced surface temperature beneath a gaseous atmosphere. Any other destabilising influence is neutralised by a change in the rate of overturning.

Mike Flynn
Reply to  ferdberple
December 21, 2023 3:00 am

Damn! And here’s me thinking that the Sun warmed the surface, which then cooled in the absence of sunlight.

Maybe the 44TW of energy the Earth loses accounts for cooling – slow but inexorable.

Editor
Reply to  Mike Flynn
December 21, 2023 10:25 am

The sun does warm the (land) surface, but the land does not retain the heat – deserts are cold at night. For climate, you have to look at the ocean, and specifically you have to look at the radiation that penetrates into the ocean, and that is sunlight not GHG radiation.

bnice2000
Reply to  Mike Jonas
December 21, 2023 10:50 am

thumbs.png
Jim Masterson
Reply to  Mike Jonas
December 21, 2023 10:45 pm

Deserts are cold at night because there is no water vapor in the overlying atmosphere–they are dry. Tropical forests at the same Latitude are much warmer at night because of the presence of water vapor.

Notice also, that the levels of CO2 are essentially identical in both regions. So the difference can’t be due to CO2.

It’s not always true, but in late Fall a clear night may have frost where a cloudy night won’t. And I’m talking about the Northern Hemisphere. The Southern Hemisphere has opposite Seasons.

Red
December 20, 2023 11:31 pm

It seems to me the term feedback is often inappropriately used when discussing climate related topics. It would be great to see the authors or others idea of what feedback is.

Jim Masterson
Reply to  Red
December 21, 2023 10:52 pm

The usual idea of feedback is that some of the output of a system is fed back into the input of the system. You can hear feedback in action when you hear a public address system squealing.

Steve Richards
Reply to  Red
December 24, 2023 5:05 am

I think we have heard of “Every action has an equal and opposite reaction

Perhaps a reaction could be suitable.

Bob Irvine
December 20, 2023 11:34 pm

The point of my essay seems to have been misunderstood.
Energy from solar forcing stays in the system for longer than Energy remitted by CO2 and it therefore will have higher efficacy.
A lot of study has gone into finding solar multipliers like cosmic ray effects etc. in an attempt to explain the historical relationship between solar forcing and temperature.
The question I was trying ask is, “could this higher efficacy also play a part?”.

If it is significant then we can have a much better understanding of climate sensitivity.
I was not trying to estimate climate sensitivity. That is a very complex area. I was simply suggesting possible sensitivities if this efficacy difference is taken into account as an example.

I would be interested to hear any thoughts on this efficacy issue. I’m yet to hear a cogent argument against it. This doesn’t mean there isn’t one of course.

Editor
Reply to  Bob Irvine
December 21, 2023 12:53 am

It’s about time someone spelled out clearly the difference in effect between wavelengths, as you have done in this article. I await a counter argument with interest.

Bob Irvine
Reply to  Mike Jonas
December 21, 2023 4:13 am

Yes Mike. There are currently 52 comments on this thread and yours is the only one that addresses the issue discussed in the essay.
Forcing efficacy could potentially make a huge difference to our understanding of climate sensitivity.
It is however a little unorthodox and requires a leap into a poorly understood complex area. The IPCC won’t take that leap, but I was hoping some of the scientists here could offer an opinion at least.

Ron Clutz
Reply to  Mike Jonas
December 21, 2023 9:29 am

indeed. The difference in effect between wavelengths is quite extreme and hidden in numbers for watts per sq. meter radiation estimates.

comment image?w=1000

The energy of earthshine is a small fraction of sunshine energy.

bnice2000
Reply to  Mike Jonas
December 21, 2023 10:53 am

I have many times noted the much greater penetration of UV and light into the oceans.

We should also be looking at shifts in the amounts different frequencies, because even in the UV band, ocean penetration is very frequency dependent.

Mike Flynn
Reply to  Bob Irvine
December 21, 2023 1:27 am

“Energy from solar forcing stays in the system for longer than Energy remitted by CO2 and it therefore will have higher efficacy.”

Energy from the Sun warms the surface. At night, all that energy is radiated to space. CO2, like all other matter, absorbs and emits energy. “Efficacy” is just more jargon in this context.

Editor
Reply to  Mike Flynn
December 21, 2023 10:28 am

What you say about the (land) surface is correct. But the article is about the oceans not the land.

Mike Flynn
Reply to  Mike Jonas
December 21, 2023 7:35 pm

Mike Jonas,

it’s true about the ocean surface too.

No Trenberthian heat hiding in the depths.

Richard Greene
Reply to  Bob Irvine
December 21, 2023 2:54 am

The Mr. Irvine who wrote the article stated:

“I am proposing here a solar ECS of about 5.2C and a CO2 ECS of about 1.3C”

The Mr. Irvine who wrote this comment stated:

“I was not trying to estimate climate sensitivity”

  • If you were NOT trying to estimate climate sensitivity, then why did the 1.3 number appear in your article? It sure seemed like an estimate to me, and a very reasonable one.
Joseph Zorzin
Reply to  Richard Greene
December 21, 2023 3:13 am

Is his “solar ECS of about 5.2C” also reasonable? This topic is way over my head.

Joe Born
Reply to  Bob Irvine
December 21, 2023 6:16 am

Perhaps you could flesh out your question a little better.

I understand that you believe–and I accept for the purposes of discussion–that energy received as short-wave radiation resides longer than energy received as long-wave radiation. But how would that imply greater sensitivity?

If all the long-wave energy is delivered right at the surface, the surface heats more quickly than if the delivery were spread through some depth, so presumably the energy radiates away more quickly. In the long-wave case, that is, the surface gets hotter but cools more quickly, whereas in the short-wave case the surface cools more slowly but wasn’t as hot to begin with. To me it’s not self-evident that those effects don’t cancel out and leave climate sensitivity unaffected.

Here’s another observation to give you a sense of my difficulty. I don’t think it’s residence time per se that causes the greenhouse effect so much as the fact that that the same energy is “counted” more than once. To oversimplify: without the greenhouse effect a quantum of energy the surface receives as radiation directly from space gets re-emitted back to space. With the greenhouse effect, on the other hand, the same quantum bounces between the atmosphere and the surface a few times before it returns to space and thereby is responsible for higher radiation power than without the greenhouse effect: by Stefan-Boltzmann, a higher temperature. Yes, there’s more residence time, but what’s central to the effect is that the same quantum is “counted” more than once.

Could explain where in your proposal the multiple counting comes in?

Editor
Reply to  Joe Born
December 21, 2023 3:35 pm

Fair question. Bear in mind that this article is not primarily about the greenhouse effect, it is about the different effects of different wavelengths. The shorter wavelengths from sunlight warm the oceans over a long period, and that’s relevant to climate. The energy from the longer wavelengths goes straight back into the atmosphere and is soon lost to space. The estimation in the article that in the long term the short wavelengths have about four times as much effect on climate as long wavelengths seems pretty reasonable. But I don’t think that anyone is claiming that this is the last word.

Bob Irvine
Reply to  Joe Born
December 21, 2023 7:10 pm

Thanks Joe
Yes the quantum is counted more than but is also measured more than once and that is the definition of temperature.
Effective Radiation Forcing is a well understood concept and depends on residence time. See the papers referenced in the post.
As far as I know this not controversial.
It is the way I see it. Doesn’t mean it’s correct of course.

Joe Born
Reply to  Bob Irvine
December 22, 2023 2:29 am

Thanks for the response. I can’t take the time right now to completely rule out the possibility that you’re on to something. But at this point it looks to me as though you’ve confused residence time as a result with residence time as a cause.

I’m perfectly comfortable with the notion that sensitivities to different types of forcing differ. But at first glance it appears that the particular writing on which you rely merely postulatse some lower effective forcing, i.e., some degree of decoupling between surface and top-of-the-atmosphere temperature responses. (“Imagine, for example, that the atmosphere alone (perhaps through some cloud change unrelated to any surface temperature response) quickly responds to a large Radiative Forcing to restore the flux imbalance at the TOA (Top Of Atmosphere), yielding a small effective climate forcing.” And, although the term quickly is used, to me it seems that it’s a result of the lower effective forcing he’s postulated (“Imagine”) rather than its cause.

Again, though, I haven’t taken enough time with this to be sure I’m right.

David Dibbell
Reply to  Bob Irvine
December 21, 2023 6:33 am

I think the most important and interesting point being addressed in this essay is the timing of the earth system response to energy flow, and the different absorbing characteristics of land and ocean.

Please consider the points made in these three videos and the accompanying text descriptions on YouTube.

https://youtu.be/Yarzo13_TSE
Yes, the land responds very quickly to the pulses of daytime solar heating. Oceans not so much. In any case, the question about CO2 is whether one should ever expect to be able to isolate the effect of incremental CO2 for reliable attribution. I think not.

https://youtu.be/I0OCzxUyMqQ
Similar point, with images for CONUS instead of Full Disk.

https://youtu.be/hDurP-4gVrY
Concerning the atmosphere’s operation, it becomes clear that energy conversion acts very quickly. This leads me to conclude that the ECS of CO2 or any other non-condensing GHG cannot be reliably differentiated from zero in the real atmosphere. I don’t take issue with the estimates of the static radiative effect of, say, 2XCO2, and the corresponding theoretical temperature response of ~1.3C. But the atmosphere is not static. The physics of compressible fluid flow overwhelm the static radiative effect.

Thank you for asking for our thoughts.

Bob Irvine
Reply to  David Dibbell
December 21, 2023 6:59 pm

David
I agree that the climate, if viewed as a massive heat engine, will move an enormous amount of energy and act as a strong negative feedback as you say.
This may, as you say, largely negate any GHE. The GH effect is approximately 33C at the surface so it is still relevant.
Your point, when we drill into it, is based on residence time as mine is so the arguments have a lot in common.

Richard M
Reply to  Bob Irvine
December 21, 2023 10:14 pm

There’s a couple of problems in your description. I realize you are just using climate science claims. However, they have problems.

The 3.7 watts/m2 of DWIR at the surface does not cause any warming. You correctly point out that some of that energy goes into evaporative cooling. The rest of the energy is simply conducted back into the atmosphere due to the 2LOT. The end result is that energy cools the surface.

The only warming of the atmosphere comes from ~3 watts/m2 of increased absorption at the edges of the 15 mm frequency band. That is energy which would have been radiated out through the atmospheric window.

The added water vapor then induces stronger convection currents which leads to thicker clouds and a reduction in high altitude water vapor. Both of these are cooling effects which counter the increased energy released during condensation as well as the increased energy absorption from the atmospheric window.

The resulting ECS is likely to be very close to zero.

Jim Gorman
Reply to  Bob Irvine
December 22, 2023 5:08 am

Energy from solar forcing stays in the system for longer than Energy remitted by CO2 and it therefore will have higher efficacy.

I can believe this for the oceans. Not so much for land surfaces. Land loses heat from conduction, evaporation, and radiation. Land obviously has more mass than CO2 and the radiation from that mass is lost based on temperature. SB is ok for black bodies but doesn’t really apply unless you also include the specific heat and masses of the bodies being warmed and cooled. CO2 just can’t be cause. H2O can be the cause. This upsets your thought experiment and CAGW because it acts differently from CO2.

Roy Clark
December 20, 2023 11:41 pm

The concepts of radiative forcings, feedbacks and climate sensitivity are pseudoscientific nonsense that are derived from an oversimplified one dimensional equilibrium or steady state climate model. The basic model was first introduced by Arrhenius in 1896. He used a uniform air column with a single start temperature (288 K). This was illuminated by a fixed 24 hour average solar flux. The surface was a partially reflective blackbody with zero heat capacity. When the CO2 concentration was increased, the surface temperature had to increase to maintain the steady state flux balance imposed in the model. Any warming was a mathematical artifact of the simplified model calculations. In 1967 Manabe and Wetherald (MW67) copied this basic model and added a 9 or 18 layer radiative transfer model with a fixed relative humidity distribution (MW67). They also constrained the lapse rate to 6.5 K km-1. Given the limited spectral data available to M&W, the radiative transfer algorithms were quite reasonable. Unfortunately, they chose to force their model back to a steady state condition after the CO2 concentration was changed. At each step in their model integration, a very small temperature increase was allowed to accumulate. The initial CO2 induced warming artifacts were then amplified by a ‘water vapor feedback’. This was a second mathematical artifact created by the fixed relative humidity assumption. It took a year of integration time (step time multiplied by the number of steps) to force the model back to a steady state so that the flux balance was restored at the top of the model and the air layer temperatures were stable. When the CO2 concentration was doubled from 300 to 600 ppm, the increase in temperature for clear sky conditions was 2.9 °C (from Table 5 of MW67). This is the original source of the ‘climate sensitivity’.
 
This model was blindly copied by the NASA Goddard group in 1976 (H76) and 10 more minor IR species were added including methane and nitrous oxide. (Chlorofluorcarbons were first added by Ramanathan in 1975.) All of the warming was created by the mathematical artifacts from the simplified MW67 model. The MW 67 model was ‘improved’ by Hansen’s group in 1981 (H81). They added a ‘slab’ ocean, a CO2 doubling ritual and the calculation of a global mean temperature record. The H81 model was tuned so that the ‘climate sensitivity for a doubling of the CO2 concentration from 300 to 600 ppm produced an increase in temperature of 2.8 °C. H81 provided the foundation for the climate modeling fraud we have today.
 
The surface temperature is determined at the surface by four main interactive, time dependent flux terms, the absorbed solar flux, the net LWIR cooling flux, the moist convection (evapotranspiration) and the subsurface thermal transport.
 
It is impossible for the change in long wave IR (LWIR) flux produced by a so called greenhouse gas forcing to cause any kind of climate change. Any temperature increases are too small to measure. There can be no climate sensitivity. There are five parts to this analysis:
 
1) It is impossible for the small decrease in LWIR flux (radiative forcing) at the top of the atmosphere to couple to the surface because of molecular line broadening effects in the troposphere.
 
2) There is no thermal equilibrium or steady state, so a change in flux has to be interpreted as a change in the rate of cooling (or heating) of a set of coupled thermal reservoirs. In the troposphere, at low to mid latitudes, a doubling of the CO2 concentration from 300 to 600 ppm produces a maximum decrease in the cooling rate, or a slight warming of +0.08 C per day. This is too small to measure in the normal temperature variations found in the turbulent boundary layer near the surface.
 
3) Over the oceans, the penetration depth of the LWIR radiation is less than 100 micron (0.004 inches). Here it is fully coupled to the wind driven evaporation or latent heat flux. At present the annual increase in average CO2 concentration is near 2.4 ppm per year. This produces an increase in the downward LWIR flux to the surface of approximately 0.034 W m-2 per year. There can be no ‘water vapor feedback’ in the evaporation process at the ocean surface. Any increase in ocean surface temperature increase produced by an increase in CO2 LWIR flux is too small to measure.
 
4) Over land, almost all of the absorbed solar flux is dissipated within the same diurnal cycle in which it is received. There is a convection transition temperature each evening when the convection stops and the surface continues to cool more slowly by net LWIR emission. This transition temperature is reset each day by the local weather system passing through. Any surface warming produced by an increase in downward LWIR flux from CO2 is too small to measure.
 
5) There can be no CO2 signal in the global temperature record. The main term is temperature change from ocean oscillations, mostly the Atlantic Multidecadal Oscillation (AMO). There is an obvious peak near 1940 from the warming phase of the AMO (See figures 3 and 5 in H81). In addition, there is heating from urban heat island effects, changes to the weather station rural/urban mix and ‘adjustments’ related to homogenization.
 
More information on climate pseudoscience is available at:
 https://venturaphotonics.com/files/VPCP_032.1_ClimateAlgebra.pdf
 
A more detailed discussion of climate energy transfer is provided in the recent book ‘Finding Simplicity in a Complex World – The Role of the Diurnal Temperature Cycle in Climate energy Transfer and Climate Change’ by Roy Clark and Arthur Rörsch. A summary and selected abstracts including references relevant to this discussion are available at:
https://clarkrorschpublication.com/.

cilo
Reply to  Roy Clark
December 21, 2023 1:13 am

…this is the stuff I lurk around this site for!

Tom Abbott
Reply to  cilo
December 21, 2023 4:10 am

Me, too. I want to see a good debate on ECS.

Climate alarmists claim the “science is settled” but obviously it is not.

Alarmist climate science is a House of Cards.

Stephen Wilde
Reply to  Roy Clark
December 21, 2023 1:39 am

Useful history.
The fundamental error arose in 1976 when the Arrhenius model was used by NASA as a base for subsequent models.
That left out the effects of conduction and convection in a mobile atmosphere because the small scale Arrhenius model could not replicate the effect of the exponential rate of decline in density and temperature with height observed in the real world.
None of the models currently in use are fit for purpose.
NASA knows a lot about radiation of energy but apparently nothing much about meteorology.

Tom Abbott
Reply to  Roy Clark
December 21, 2023 4:07 am

Well, the written, historical temperature record doesn’t show any effects from more CO2 in the atmospehre. It’s no warmer today than in the recent past, yet there is much more CO2 in the air today than then. Increased CO2 has had no discernable effect on the temperatures.

Richard Greene
Reply to  Tom Abbott
December 21, 2023 9:00 am

“Increased CO2 has had no discernable effect on the temperature”

That claim is total BS

CO2 alone could explain the entire change of temperature since 1940 based on the expected warming from lab spectroscopy measurements and a small water vapor positive feedback..

It would be difficult to explain the increased greenhouse effect since 1975 without using CO2 emissions as a cause because the only other cause would be more night cloudiness, for which we do not have accurate global average data.

The exact causes of the warming since 1975 are unknown.

Those who claim only CO2 are guessing. Those claiming CO2 did nothing are guessing too. Both are guesses by fools. The right answer is we do not know.

The evidence so far suggests a mix of manmade and natural causes of the post 1975 warming, with more evidence of manmade causes.

We do not know is still the correct answer, which you missed.

Mike
Reply to  Richard Greene
December 21, 2023 2:05 pm

CO2 alone could explain the entire change of temperature since 1940….

The evidence so far suggests a mix of manmade and natural causes of the post 1975 warming, with more evidence of manmade causes.

Oh what a load of made-up crap. The temp FELL from 1940 to ’75. Since then there has been half a degree of warming – meaningless. Since 1940 much less. Even more meaningless. How can you possibly extract a human signal from that?

cilo
Reply to  Mike
December 22, 2023 2:06 am

…oh, oh, oh, add the bit where their entire argument for warmunism rests on temperature records that are regularly “adjusted” to conform to their theory, plus the bit about siting weather stations on paved land, plus the shenanigans with the actual physical operation of their probes, plus the fraud they commit in recording those fraudulently quoted probes (this issue with their probes has been extensively discussed by people knowledgeable in a variety of field specialities, on this site, repeatedly and in great detail, when I say fraud, the evidence exists).
“CO2 alone could explain the entire…” is a careless philosophy.

Tom Abbott
Reply to  Mike
December 22, 2023 4:47 am

I don’t think there has been any warming since the Early Twentieth Century.

If you look at historic temperature charts, instead of bastardized Hockey Stick charts, they all show it was just as warm in the Early Twentieth Century as it is today, so there is very little, if any warming, going on in the world, and the United States has been in a temperature downtrend since the 1930’s.

James Hansen said the 1930’s were the hottest decade, and 1934 was the hottest year, and 1934 was 0.5C warmer than the year 1998, which makes it 0.4C warmer than 2016, and 0.2C warmer than Hunga Tonga.

Tom Abbott
Reply to  Richard Greene
December 22, 2023 4:38 am

RG: “It would be difficult to explain the increased greenhouse effect since 1975 without using CO2 emissions as a cause because the only other cause would be more night cloudiness, for which we do not have accurate global average data.”

The increased greenhouse effect? I beleive you mean an increase in temperatures since 1975, and are unconsciously attributing that to the greenhous effect.

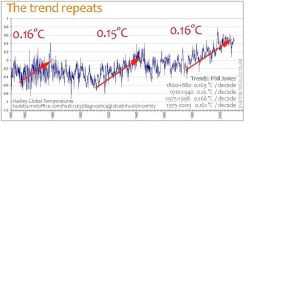
The temperature increase from the 1910’s to the 1940’s was of the same magnitude as the current temperature increase from 1979 to today.

There was less CO2 in the air from 1910 to 1940, than there is now from 1979 to today, but the temperature increases were the same.

What caused the warming from the 1910’s to the 1940’s?

What caused the warming from the 1850’s to the 1880’s, which warming was also of the same magnitude as the subsequent warmings?

RG: “The exact causes of the warming since 1975 are unknown.”

Mother Nature is the cause of warming until proven otherwise, and it has not been proven otherwise, as of today.

PhilJones-The Trend Repeats.jpg
Tim Gorman
Reply to  Roy Clark
December 21, 2023 5:15 am

4) Over land, almost all of the absorbed solar flux is dissipated within the same diurnal cycle in which it is received.”

The stead-state, average value of radiation does not consider that the nighttime temperature curve is an exponential decay (or more closely a polynomial decay). That means that if the heat absorbed during the day causes the starting temp of the decay to increase then the amount of radiation at the start of the decay is higher. Thus more heat gets radiated per unit of time. The proper way to evaluate this is to integrate the nighttime temperature decay curve to obtain total heat radiated. As daytime heat absorbed goes up so will the amount of heat radiated at night.

Averages *always* lose information needed to properly understand physical processes. Climate science “averages” are no different.

Dradb
December 21, 2023 12:02 am

You suggest “ECS surface temperature guess of 5.2C (approx.) for a 3.7w/m^2 increase in solar forcing”.
What would you suggest for a 94 w/m^2 increase in solar forcing? In other words, 25 times your 3.7. That is the difference in solar forcing between the Earth’s aphelion and perihelion. The impact on global temperature is zero. Check any tropical island such as Kiribati and you will find the temperature is constant year round.

Frank from NoVA
Reply to  Dradb
December 21, 2023 7:28 am

‘What would you suggest for a 94 w/m^2 increase in solar forcing?’

An excellent question.

I note that the difference between summer-winter insolation was also (way too) briefly mentioned in the Wijngaarden & Happer (2023) paper (page 7) that was recently discussed here on WUWT:

https://wattsupwiththat.com/2023/11/21/atmosphere-and-greenhouse-gas-primer/

Given that 1) climate alarmism ‘requires’ feedbacks on the initial CO2 forcing of 3 – 3.7 W/m^2 in order to scare us into submission, and 2) these feedbacks should supposedly operate regardless of the source of the initial forcing (CO2, insolation, etc.), the alarmists really need to tell us why the above difference in solar forcing doesn’t matter but our consumption of fossil fuels does.

Stephen Wilde
December 21, 2023 12:35 am

Actually, it is much simpler.
The only delay in energy residence time that matters is that involved in convective overturning of atmospheric mass. That is the time taken for surface kinetic energy to be converted to atmospheric potential energy and back again.
Every other factor that might influence that residence time is neutralised by a change in the rate of such overturning via local or regional changes in the lapse rate slope.
The ocean heat content is similarly constrained by local or regional changes in the evaporation rate and that rate averaged globally is fixed by the weight of atmospheric mass bearing down on the ocean surface.
Thus the equilibrium sensitivity to anything other than atmospheric mass is zero.
There will however be changes in atmospheric air circulation which will show up as shifts in the boundaries positions and intensities of the permanent climate zones. In the case of CO2 such changes would be indiscernible from natural variations.

Peta of Newark
December 21, 2023 12:40 am

What did the 2nd Law do to deserve such hideous mistreatment.
What is it that propels folks to ignore *everything* they see and feel around themselves, every second of every day, about how warm and cold objects interact.

>>When ‘energy’ (as in infra-red or visible light) interacts with ‘substance’ so as to raise the temperature of ‘substance’, electromagnetic energy is being converted to mechanical energy = the Brownian motion of the molecules/atoms of substance.
The atoms and molecules are having their momentum changed
i.e. They are being accelerated, it takes ‘force moving through distance‘ to do that

That is the working principle of any and all Heat Engines = ‘energy’ of some form or other is becoming Mechanical Energy = Motion

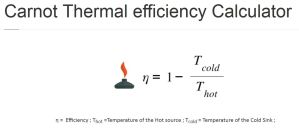
As such Carnot’s Heat Engine Equation applies
It is simplicity itself, all you need to know is the input temperature of your engine and its output temperature.
Using only those 2 numbers and then you can calculate the efficiency of the engine = how much of your input energy becomes mechanical energy and how much is lost to ‘Entropy’
We do NOT need to know what form that energy is in.

Carnot as attached, from here

For Sol heating Earth’s surface: (using the calculator at the link)
Input temp =5,500 Kelvin
Output temp = 15°C = 288Kelvin
Efficiency = 94.7%
i.e Sol is very efficient at heating Earth’s surface, only 6% of the energy is lost to entropy

For a coal fired power station
Input temp (to the steam turbine) = 200°C = 473Kelvin
Output temp of the turbine (= the cooling tower) =30°C = 303Kelvin
Efficiency = 36%. (a figure we all should recognise)
64% of the energy in the coal is lost- Power stations are ‘not the best

For the surface heating the atmosphere
Input temp = 288 Kelvin
Output temp = 258 Kelvin (the generally accepted figure for the average temp of the troposphere = minus 15°C)
Efficiency = 10.4%
Earth’s surface is a very poor heater of the atmosphere – 90% of the energy is lost

For Earth’s atmosphere heating the Earth’s surface
Input temp = 258Kelvin
Output temp = 288 Kelvin
Efficiency = minus 11.6%

i.e. The idea that the atmosphere heats the surface is absurd
It does the exact opposite, the 2nd Law, Entropy, Carnot and even Stefan all say as much

Or try it another way: The greenhouse effect is akin to you covering all the internal walls of your house with mirrors and expecting it to become toasty warm inside
try to understand why not

And mirrors are 95+% efficient at reflecting all the electromagnetic energy that hits them yet that reflected energy CAN NOT (re) heat the object/substance/stuff/thing that emitted it.
CO₂ ‘reflects’ at best 50% of the miniscule (pulled out of someone’s ass: 3.7Watts) it absorbs

If that tiny amount is absorbed by Earth surface, it equates to a heat engine with negative efficiency as the CO₂ will be, at best, at the average temp of the troposphere = minus 15°C

Will someone please tell us what an engine with negative efficiency looks like – Show us pictures please or it didn’t happen

Carnot.JPG
Stephen Wilde
Reply to  Peta of Newark
December 21, 2023 12:52 am

The atmosphere cools the surface via upward convection during the day but reduces the cooling rate via downward convection during the night.
The net effect is an increase in energy residence time.
Due to rotation the effects are masked by the upward and downward motions being spread around the entire surface.
Instead of a rising cell on the day side and a falling cell on the night side we see the Hadley, Polar and Ferrel cells smeared meridionally around the globe.

Peta of Newark
Reply to  Peta of Newark
December 21, 2023 12:57 am

I’m sure everyone is now feverishly working out the efficiency of Earth’s atmosphere heating outer/deep space
Two situations: Before ‘warming’ and after ‘warming’

Before warming
Input temp = minus 15°C or = 258 Kelvin
Output temp = 4 Kelvin
Efficiency = 98.4496%

After 5 degrees of ‘warming’
Input temp = minus 10°C or = 263 Kelvin
Output temp = 4 Kelvin
Efficiency =98.4791%

IOW, Global warming means that the atmosphere becomes more efficient (better) at heating deep space.

What does that mean, how do you interpret that?
I see Earth’s atmosphere losing, in real terms and in real Joules, more energy than before.
iow. I see Global Cooling

cilo
Reply to  Peta of Newark
December 21, 2023 1:21 am

I think if we throw it all together, we’ll find an atmosphere that dynamically expands and contracts under electrostatic tension so that any temperature anomalies are compensated for by the basic pressure/ temperature relation in all gasses.
Measuring the brightness of a radiating body )(at a specific wavelength, to top it all!) gives you no information other than brightness, the rest is all inferred, and our understanding of the geosphere is far too limited to make those inferences totally trustworthy.
Oh, and “Lithosphere”. You ain’t gonna make sense until you include the lithosphere. Have to insert the lithosphere there somewhere. And weather modification programmes, still have to see them represented in the models…

Richard Greene
Reply to  Peta of Newark
December 21, 2023 2:45 am
  • “I see Global Cooling”
  • The second half of 2023 will be the warmest six months in at least 5000 years. 
  • Brave of you to see cooling ahead
  • Because we need more long term climate predictions … after every one of them had been wrong for over a century … but I’m sure you got it right this time
Tom Abbott
Reply to  Richard Greene
December 21, 2023 4:29 am

“The second half of 2023 will be the warmest six months in at least 5000 years.”

Where’s the evidence for that?

Richard Greene
Reply to  Tom Abbott
December 21, 2023 9:19 am

The evidence is based on averaged climate reconstructions that have not been able to prove any period in the past 5000 years was warmer than the past 10 years. That does not mean a hocky stock existed. It just means we do not have accurate global average data, and the data we have can’t prove any warm periods in the past 5000 years were warmer than the last half of 2023.

The Holocene Climate Optimum reconstructions, from 5000 to 9000 years ago, when averaged, do show at least +1 degree warmer than the past 10 years. Other warm periods reconstructions when averaged show no more than +0.5 warmer than the past ten years, which is certainly below the margin of error in the estimates.

The last six months of 2023, hot from the El Nino, will be the hottest six months in the post-1979 UAH temperature record, helped by an El Nino starting in June, unusually early in the year

The climate reconstructions are LOCAL educated guesses. When average together to create a fake global average temperature, the variations are smoother (reduced).

There is no evidence of any warmer six month period than the last six months of 2023.

And that’s good news
Warm is good
Cold is bad

Mike
Reply to  Richard Greene
December 21, 2023 2:20 pm

The evidence is based on averaged climate reconstructions that have not been able to prove any period in the past 5000 years was warmer than the past 10 years.

Do you actually believe your own drivel? Do you believe that centuries of a warm arctic for periods of centuries 1000 and 2000 years ago was only regional? The trees below were under the ice from between 1000 and 2000 or more years. They were between 100 and 300 years of age before they were covered. You Michael Mann enthusiasts are really becoming tiresome.

anicent tree.JPG
Richard Greene
Reply to  Mike
December 22, 2023 5:13 am

I specifically wrote there is no proof of a hockey stick trend and wrote that averaged LOCAL climate reconstructions are not accurate enough to PROVE any period in the past 5000 years was warmer than the second half of 2023 will be.

Science requires data. Conclusions require appropriate data. Guesses do not.

My comments are not drivel — You need better reading skills

Arctic reconstructions are local. They prove nothing about the global average temperature. You cannot assume one local reconstruction represents a global average.

I believe Michael Mann is a fraud

I also believe consensus climate science is not 100% wrong and many climate questions have the correct answer of “We do not know that”

Tom Abbott
Reply to  Richard Greene
December 24, 2023 3:38 am

“The evidence is based on averaged climate reconstructions that have not been able to prove any period in the past 5000 years was warmer than the past 10 years.”

You must not be paying attention.

Hansen 1999 proves it was warmer in the 1930’s in the United States that it is now.

And written, historical Tmax charts and Tavg charts from all over the world show it was just as warm or warmer in the Early Twentieth Century as it is today.

I’ve posted those charts numerous times in trying to make this same case.

So, you don’t believe in the written, historical temperature records? Do you just blank them out of your mind when you consider temperatures? I don’t get it. You are ignoring the evidence right in front of your eyes that shows it is no warmer today than in the recent past.

atticman
Reply to  Peta of Newark
December 21, 2023 3:55 am

Let’s simplify it even further. If one assumes (not unreasonably) that deep space, being infinite and rather cold, has an infinite capacity to absorb heat, then any additional heat in the Earth’s atmosphere will eventually end up there, the rate of transfer being a function of the temperature difference between the two. Earth’s temperature is, effectively, self-regulating, as Willis Eschenbach has demonstarted.

Richard Greene
Reply to  Peta of Newark
December 21, 2023 2:01 am

“The idea that the atmosphere heats the surface is absurd”

Your statement is absurd.
Radiation that heats the surface, called back radiation, is the greenhouse effect. It is measured 365 days a year and you deny that it exists. You are a science denier, claiming there’s no greenhouse effect, contradicting more than 99.9% of scientists living on our planet and measurements of back radiation too.

You are applying some wacky kind of thermoDUMBnamics “principles” that you have obviously invented all by yourself.

All objects at temperatures less than absolute zero emit radiation.

Because greenhouse gas molecules radiate heat in all directions, some of it spreads downward and ultimately comes back into contact with the Earth’s surface, where it is absorbed.

The temperature of the surface becomes warmer than it would be if it were heated only by direct solar heating.

This supplemental heating of the Earth’s surface by the atmosphere is the natural greenhouse effect.

Mike Flynn
Reply to  Richard Greene
December 21, 2023 2:52 am

Richard,

“The temperature of the surface becomes warmer than it would be if it were heated only by direct solar heating.”

No. The atmosphere prevents 30% or so of the Sun’s radiation from reaching the surface. On the airless Moon, receiving 100% of the Sun’s radiation, temperatures after the same exposure time can reach about 125 C, compared with 60 C on Earth.

The atmosphere can radiate all it likes, but if it is cooler than the surface, no surface heating occurs. Even when the atmosphere is warmer, at night with a low level inversion, say, the surface still cools.

The Earth has cooled considerably since it was molten. Accept reality.

Richard Greene
Reply to  Mike Flynn
December 21, 2023 9:24 am

It is obvious that quoted statement means the sunlight that reaches earth’s surface, but you had to be an annoying nitpicker

Do you deny the greenhouse effect too?

Richard M
Reply to  Richard Greene
December 22, 2023 6:34 am

The “greenhouse effect” is pseudo-science. It ignores several aspects of our atmosphere. I realize it is not easy. There really is DWIR towards the surface. And no, it does not result in any warming. In fact, at the surface it results in cooling. Science is hard.

Joseph Zorzin
Reply to  Richard Greene
December 21, 2023 3:20 am

“All objects at temperatures less than absolute zero emit radiation.”

less than absolute zero???

Tom in Florida
Reply to  Joseph Zorzin
December 21, 2023 4:42 am

Disregard the minus sign you use for low temperatures based on the freezing point of water. I think he means that if absolute zero is the lowest you can go, anything that is not that low is less.

Richard Greene
Reply to  Joseph Zorzin
December 21, 2023 9:32 am

I meant higher than absolute zero.

I proofread after I publish a comment and then desperately search for an edit button which I could not find. I expected to get a hard time, but that’s what the internet is for.

stevekj
Reply to  Richard Greene
December 21, 2023 6:40 am

“Radiation that heats the surface, called back radiation, is the greenhouse effect. It is measured 365 days a year and you deny that it exists.”

Can you show me this measurement? Because if you are referring to pyrgeometer measurements, the values they measure are negative at night.

“greenhouse gas molecules radiate heat in all directions”

No they don’t. That’s not what “heat” means.

mkelly
Reply to  Richard Greene
December 21, 2023 7:39 am

Richard says:”It is measured 365 days a year and you deny that it exists.”

So what! Please demonstrate why it is important.

Everything that can be counted does not necessarily count; everything that counts cannot necessarily be counted.” -Albert Einstein.

Richard Greene
Reply to  mkelly
December 21, 2023 9:50 am

CO2 water vapor and night clouds al impede upwelling radiation (Earth trying to cool itself) heading toward the infinite heat sink of space.

Any radiation coming down, especially at night, when it is easiest to measure, is the result of the greenhouse effect.

There are many ways to measure back radiation:

The Amazing Case of “Back-Radiation” | The Science of Doom

And please don’t mention Einstein
I knew Albert Einstein. Albert Einstein was a friend of mine. mkelly, you’re no Albert Einstein.”

bnice2000
Reply to  Richard Greene
December 21, 2023 11:07 am

Insufferable arrogance, blended with mindless lukewarmer ignorance.

Hilarious. !! 🙂

mkelly
Reply to  Richard Greene
December 21, 2023 2:26 pm

The effect of back your back radiation warming the earth.

IMG_0258.jpeg
stevekj
Reply to  Richard Greene
December 22, 2023 5:37 am

“There are many ways to measure back radiation:”

All of the ways of measuring “back radiation” power (from colder objects such as the atmosphere) produce negative measurements. But you knew that, right?

Richard M
Reply to  Richard Greene
December 22, 2023 7:58 am

Once again, you confuse energy flow with temperature and even worse, you cherry pick only part of the energy flow. While the larger view is more complex, it’s requires no special physics.

Bill Johnston
Reply to  Richard Greene
December 21, 2023 4:37 pm

Mmmmmmm,

How does one get “temperatures less than absolute zero” that you claim “emit radiation”.

Just askin,

Cheers,
Bill

Richard M
Reply to  Richard Greene
December 22, 2023 6:28 am

Richard simply can’t accept any conclusions that go against his predetermined view. He obviously didn’t even read the science Roy Clark presented above. His response is always the same, a combination of name calling and appeal to authority.

mkelly
Reply to  Peta of Newark
December 21, 2023 7:48 am

Bravo! I would only add that as the mass of the atmosphere increases due to added CO2 it takes some amount additional input energy just to get back to even. CO2 can’t heat itself.

Mike Flynn
December 21, 2023 12:52 am

“In the Earth’s case, the surface of the globe or ball is the average emission height, and this also stays at the same approximate temperature after a forcing increase, while the temperature in the interior and importantly, on the surface where we live, is warmed by increased energy residence time.”

Complete nonsense. The surface is the surface. “Forcing” is GHE cultist gobbledegook. The temperature in the interior is due to the interior being hot from residual heat and radioactivity. There is no “increased energy residence time”. During the night, the surface loses all the heat of the day, plus a little of the Earth’s interior heat.

Hence, four and a half billion years of cooling, to the Earth’s present temperature.

Nothing mysterious. No GHE required or evident.

cilo
Reply to  Mike Flynn
December 21, 2023 1:30 am

I was going to offer half an upvote, when I started thinking the third time; I think this whole war can be fought better, if we start using decent language. I offer your quoted quote as example:

and this also stays at the same approximate temperature after a forcing increase,

Could the guy not say: ” if you turn the heat up, the thing will warm up until it settles at the new temperature, same for colder.”?
Needlessly haughty language is a great barrier between the working masses, and those supposedly thinking for them (on taxpayer subsidy, 9/10)

Joseph Zorzin
Reply to  cilo
December 21, 2023 3:24 am

“Needlessly haughty language… ”

The signature of all priesthoods.

Richard Page
Reply to  Mike Flynn
December 21, 2023 1:35 am

Entropy.

Richard Greene
December 21, 2023 2:31 am

In the wacky world of modern climate science, everyone is entitled to one guess of CO2’s ECS.

We may have a different guess for r each climate scientist

The obvious answer is no one knows the actual ECS of CO2 in the atmosphere. And no one can knw. because there are many climate change variables so the effect of CO2 alone can not be derived from global average temperature statistics.

Unfortunately, “we don’t know” is an unacceptable answer to a climate question even though it is the right answer for many climate questions.

The best guess is to start with the effect of CO2 alone from lab spectroscopy in the HITRAN or MOTRAN databases, and then maybe add a modest water vapor positive feedback to it.

Scientists using these databases with and without a modest water vapor feedback have estimated a ECS of from 0.75 to 1.5 degrees C. I’nm not sure why the large range of guesses. Perhaps he lower ECS numbers have no positive feedback and the higher numbers have a positive feedback that forms over several hundred years.

While the author’s guess of +1.3 C. is a middle of the road, it can not be taken seriously because real science requires four or more decimal places.

My own submission in the Guess the ECS Contest is real science: +1.2749 degrees C. +/- 0.5 degrees C. (my model had seven decimal places but my dog ate my papers and I could only remember four of them)

My model is not a hat filled with scraps of paper with random numbers on them.

The exact ECS, with many decimal places, of CO2 is VERY important because we know for sure the climate will get warmer in the future, unless it gets colder.

Details of my two climate models

The Honest Climate Science and Energy Blog: Appropriate attire for adaptation to global warming

Joseph Zorzin
Reply to  Richard Greene
December 21, 2023 3:27 am

“And no one can knw. because there are many climate change variables so the effect of CO2 alone can not be derived from global average temperature statistics.”

Nailed it. So there can’t be any such thing as ECS. There ought to be some much more complex formula relating all the variables but that’s for the future to determine.

Richard Greene
Reply to  Joseph Zorzin
December 21, 2023 10:04 am

There is an ECS
You can take an ECS guess
Others will claim more, or less
On ECS, not much progress
Guessing is very stressing
I have to confess
I entered a guess ECS contest
Didn’t win
Then I was depressed
Needed lots of bedrest
The subject is complex
That’s why everyone’s perplexed

Mike
Reply to  Richard Greene
December 21, 2023 2:26 pm

There is an ECS”
Just because co2 is a radiative gas does not mean there is an ECS.
Are you ”sensitive” to feather on your shoulder?

Tom Abbott
Reply to  Richard Greene
December 21, 2023 4:39 am

“The obvious answer is no one knows the actual ECS of CO2 in the atmosphere. And no one can know. because there are many climate change variables so the effect of CO2 alone can not be derived from global average temperature statistics.”

That’s is the basic truth of the matter.

We are a long way from settling the science of the Earth’s climate and its interaction with CO2.

And the more we look, the more it seems that CO2 is just a benign gas that has no discerable effect on the Earth’s climate.

We should stop killing ourselves over an unreasonable, unwarranted fear of CO2.

Richard Greene
Reply to  Tom Abbott
December 21, 2023 10:13 am

We could just observe the effect of CO2 in lab spectroscopy and the actual climate change in the past 50 years … and declare that CO2 is something we need more of in the atmosphere.

And a little more global warming with the timing and pattern experienced since 1975 would be good news too.

We love our warmers winters here in SE Michigan with a lot less snow. In the past two winters we shoveled snow off the driveway just three times each winter. In the 1970s shoveling was required about once week rather than once a month.

Warm is good
Cold is bad
More CO2 is good
Less CO2 is bad

Richard M
Reply to  Richard Greene
December 22, 2023 8:13 am

The best guess is to start with the effect of CO2 alone from lab spectroscopy in the HITRAN or MOTRAN databases, and then maybe add a modest water vapor positive feedback to it.

That is known as cherry picking. A better approach is to try and understand the physics involved. Of course, that is difficult and requires some thought. But, it does include radiation physics. So, one should try and understand it too.

For example,

-How far does the average ~15 mm surface emitted photon travel before being absorbed in the atmosphere?

-How far does the average photon emitted from any layer of the atmosphere travel before reabsorption?

-How often does energy absorbed by a gas get immediately remitted vs. passed on to other atmospheric molecules via kinetic collisions?

-What is the most common form of energy transfer by atmospheric molecules and surface molecules?

As it turns out, not knowing the answer to these questions (and many others) can easily lead you astray. Do you now see why your approach might be wrong?

Tom in Florida
December 21, 2023 4:49 am

“We put a jacket on, and our body heat is retained for longer. We warm up.”
Bad example. We warm up because our internal body heat continues to create warmth, not so with non heat producing objects. If you put a jacket on a sun warmed log, the jacket only retards the cooling of the log but does not increase it’s warmth above what it already was.

Joseph Zorzin
December 21, 2023 5:10 am

So, the premise of this discussion is: “Is it possible to simplify the climate sensitivity debate?”

After reading the essay and 61 comments, it appears it’s premise is not yet resolved. As we all know, though much of the world doesn’t, the science ain’t settled. At least we bother to debate/discuss it.

Quondam
December 21, 2023 5:20 am

That the adiabatic lapse rate is an equilibrium property is a fundamental law for the climate scientist, never to be questioned. Thermal gradients exist due to convective equilibrium, but are independent of convective energy fluxes. This might seem a bit odd to one somwhat aquainted with dissipative descriptions of electric and fluid flow, mais chacun à son Kool-Aid.

bdgwx
December 21, 2023 5:25 am

A 3.7w/m^2 increase in solar forcing will have a much bigger effect on surface temperature than a similar 3.7w/m^2 increase in CO2 forcing that, on average, acts in the atmosphere.

Both are a radiative force of 3.7 W/m2. Ceteris paribus both require the same radiative response (surface temperature increase) to restore the balance at TOA. The question is…does solar forcing result in more feedbacks than does CO2 forcing? What would those feedbacks be?

Bob Irvine
Reply to  bdgwx
December 21, 2023 8:06 pm

You’ve misrepresented my post. The solar forcing is on average, not absorbed at the surface but some meters below the ocean surface. It’s greater residence time in the system means it will have a greater effect on surface temperature than CO2 that is absorbed on average some where in the atmosphere.
Effective Radiative Forcing is a well studied concept and depends on residence time for its conclusions.

Richard M
Reply to  bdgwx
December 22, 2023 8:27 am

both require the same radiative response (surface temperature increase)

Not on a water planet and not when the depth of energy absorption is different.

The other important variable is, where did the energy come from? Energy from outside the “system” will warm the “system”, while energy simply moving around inside the “system” won’t.

Frank from NoVA
Reply to  bdgwx
December 22, 2023 2:06 pm

‘Both are a radiative force of 3.7 W/m2.’

I’ll buy that the same feedbacks should operate pursuant to ‘both’ types of forcing. Question for you: Why don’t we see such feedbacks when the TOA solar insolation varies by about 90+ W/m^2 each year?

galileo62
December 21, 2023 6:17 am

Very interesting calculations but would the same theories, reasoning and conclusions regarding Co2 and global warming work on the planet Mars? After all that atmosphere is more than 95% Co2.

E. Schaffer
December 21, 2023 7:33 am

That is some really bad reasoning here. First of all, “not controversial” will not mean perfectly right. Yes, there are different perspectives, some of them defendable, others less. But such isolated perspectives are not “the truth”. Rather you will need a multitude of different perspectives, that if consistent, will give a better understanding.

Soon enough the argument becomes somewhat surreal. How does water have a greenhouse effect?

“Although it is not a gas, water has a much stronger greenhouse effect than do the GHGs.”

Spoiler alert: there is NO GHE in water! To be fair, I transpired this idea as well, a couple of years ago. I soon enough understood how it was nonsense. The problem was that I had not yet understood the GHE. The author here obviously has the same problem. In fact all these consideration over how deep radiation penetrates water is a logical road to nowhere.

The relevant questions, like where the 3.7W/m2 comes from, how it is based on unreasonable assumption, how evaporation reduces the GHE, or the optical properties of water – all remain untouched.

E. Swanson
December 21, 2023 7:45 am

The author claims that :
“Energy reemitted by CO2 sometimes strikes the ocean surface and is almost totally absorbed within the first 0.015mm and within the evaporation layer of that ocean surface and from there is returned very quickly to the atmosphere and space as latent heat of evaporation.”

That claim misses two things. The extra evaporation adds more water vapor to the surface boundary layer of the atmosphere. That H2O vapor is less dense than N2 and O2, which drives stronger vertical convection, moving more energy toward the Tropopause. Stronger vertical convection would change the lapse rate and increase the altitude of the Tropopause, particularly in the Tropics. Adding water vapor, a strong greenhouse gas, increases the net Greenhouse Effect beyond that due only to increasing CO2, closing part of the “atmospheric window” to deep space.

stevekj
December 21, 2023 8:44 am

Bob, you wrote “The agreed forcing for a doubling of CO2 is approximately 3.7 w/m^2 at the surface.”

Can you show me where I can measure this 3.7 W/m^2? Or any other “forcing”?

(I don’t dispute your central point, which is that different wavelengths of radiant energy travel and are absorbed differently in different parts of Earth’s environment, such as air, land, and oceans. I do have an issue with the term “forcing” and the so-called “radiant greenhouse effect” though)

The Dark Lord
December 21, 2023 9:01 am

its a chaotic system … continuing to try and find a pattern in the chaos is a fools errand …

or simply put …

The idea that there is a direct correlation between CO2 and temperature i.e. sensitivity … is a fantasy created by the global warming crowd … stop accepting their delusion …

the back of Einstein’s envelope would be blank in this case … he wouldn’t bother to try…

David Wojick
Reply to  The Dark Lord
December 21, 2023 11:21 am

Very true, well said.

Mike
Reply to  The Dark Lord
December 21, 2023 6:05 pm

its a chaotic system … continuing to try and find a pattern in the chaos is a fools errand 

But attribution models!!

David Wojick
December 21, 2023 9:21 am

Climate sensitivity to doubling CO2 is arguably the most confused concept in climate science. It refers to at least four very different things typically without clarification.

First there is the warming abstractly expected from the forcing if nothing else happens. The spread is small but this is in no way a forecast just an abstraction.

Second is the warming in a given model which typically assumes large positive feedbacks happening. The spread is huge.

Third is the supposedly empirical measure where people somehow claim to know just how much of observed warming is due to the CO2 increase. The spread is smaller than the models because there has not been much warming.

Fourth is the absurdly claimed precise amount of warming that will come from specific future emissions. For example this version is used to specify a supposedly precise value for the carbon budget we are supposed to live under. This one is nonsense because future temperatures are not determined solely by CO2 emissions. They may not even be affected by our emissions.

What is really big is the spread among these four very different concepts. Yet the term climate sensitivity is often used without saying which is meant. This systemic confusion is of course useful to alarmism.

Richard Greene
Reply to  David Wojick
December 21, 2023 10:28 am

Wojick, this is a lot of common sense logic, but you missed the boat. You failed to give us your ECS guess. Everyone is required to guess the ECS. Only then can one call oneself a climate scientist.

How about another CFACT article?
The articles there have been mediocre following your last article.

My ECS guess is 1.2875
Four decimal places
That’s real science.

David Wojick
Reply to  Richard Greene
December 21, 2023 11:20 am

My next article is on NERC ignoring extreme weather when evaluating risk to the grid.

ECS does not exist because climate is a far from equilibrium system. My estimate of CS is zero because there is no sign of GHG warming in the entire UAH record. All the warming is due to super El Niños.
https://www.cfact.org/2021/01/15/the-new-pause/
With a new step up likely given the big spike.

Richard Greene
Reply to  David Wojick
December 21, 2023 1:50 pm

El Ninos redistribute Pacific Ocean heat.

They are offset by La Ninas in the 30 to 50 years long run ofthe ENSO cycles.

Your climate science claims here are claptrap

If you are claiming the effects of CO2 in indoor lab air are completely different than the effects of CO2 outdoors, you are contradicting a century of science with a 99.9% consensus today.

If warming was only caused by El Ninos, which is false, then there can be no warming in non-El Nino years, and that is also not true.

If the ocean releases some heat to the atmosphere, then the atmosphere will be warmer and the ocean will be cooler: No net chage.

Ignoring La Ninas while focusing on El Ninos is convenient data mining.

If you are claiming there is no greenhouse effect, or that more CO2 is not increasing the greenhouse effect, then you are a science denier.

If the oceans are releasing heat at approximately five year intervals, then how did that extra heat get into the ocean? If you say from underseas volcanoes like Jumpin’ Joe Bastardi falsely claims, I’m going to start laughing.

The consecutive La Niña years of 2022 and 2021 both rank among the top 10 hottest years on record—all of which have occurred since 2010. This suggests that the short-lived global cooling effect of La Niña has not been enough to even briefly mask human-caused warming.

The UAH anomaly chart clearly shows a rising average temperature trend since 1979 with some sharp temporary peaks and troughs most likely from El Ninos and La Ninas. Each large ENSO event is followed by a reversion to the mean … and the slow +0.14 degrees C. per decade rise of the UAH temperature continues.

There is no proof that ENSO cycles cause ANY global warming or cooling in the long run.

Your false data free claim that all global warming is caused by El Ninos is Forrest Gump junk science and I can never trust your CFACT energy articles again.

Mike
Reply to  Richard Greene
December 21, 2023 6:10 pm

If you are claiming the effects of CO2 in indoor lab air are completely different than the effects of CO2 outdoors, you are contradicting a century of science with a 99.9% consensus today.

Do you actually read what you write?

There is no proof that ENSO cycles cause ANY global warming or cooling in the long run.

Define ”the long run”

Richard Greene
Reply to  Mike
December 22, 2023 5:25 am

CO2 has been identified as a greenhouse gas in a lab OVER a century ago. Those who claim CO2 is not a greenhouse gas in the atmosphere have had over a century to refute the lab spectroscopy data and THEY HAVE FAILED.

The long run for the ENSO cycles is 30 to 50 years, which I said in a prior comment.

There is no evidence that ENSO cycles are increasing earth’s average temperature in the long run.

The cycles have a temporary short term effect on the average temperature and weather patterns, but they do NOT cause the entire rising average temperature trend since 1975 as some Forrest Gump climate science buffs claim.

Mike
Reply to  Richard Greene
December 22, 2023 5:58 pm

The cycles have a temporary short term effect on the average temperature and weather patterns, but they do NOT cause the entire rising average temperature trend since 1975”

As no one knows why ENSO develops, you do not know that to be a fact. There may be lag periods spaning many decades.

macha
Reply to  Richard Greene
December 21, 2023 1:48 pm

I guess real science ain’t settled.
Earlier you posted a different 4decimal value. Which is it?

Screenshot_20231222-054647_DuckDuckGo.jpg
Richard Greene
Reply to  macha
December 22, 2023 5:33 am

After the following revisions:
infilling,
homogenization,
pasteurization,
rounding, on Thursdays and Fridays
smoothing,
time of day adjustments,
seasonal adjustments
and a fudge factor to reach the EVS number demanded by my boss (the wife), which changes every day, there was a slight change to my four decimal place ECS of CO2. In the name of science.

I am currently working on a four decimal place margin of error. My BS degree has not being wasted.

Note that I follow the NASA-GISS process for determining the global average temperature, although the boss there is not my wife.

Kevin Kilty
December 21, 2023 9:56 am

Interesting simplification suggestion, Bob, but can any simplification lead to a better grasp of this issue? There is a lot to speak about here, but first, I have some dispute with this…

the consensus is that a doubling of CO2 is consistent with a forcing increase of about 3.7 w/m^2 and, by calculation, a surface temperature increase of about 1.2C before the atmospheric feedback has acted.

I agree partially, and MODTRAN calculations back this up, that a doubling of CO2 produces a forcing of around 3.7W/m^2 noted at the top of atmosphere initially. What happens at the surface, below an IR active atmosphere is another matter. If a person takes most surface materials as having an effective emissivity of 1 (MODTRAN uses 0.97), then 3.7 W/m^2 produces 0.7C of warming at the surface, but that extra 3.7 watts emitted power (emitted power is upward from surface according to SB and irradiance is integrated downward IR intensity at the surface) at the surface warms the atmosphere leading to additional IR net flux at the surface (a feedback of the present atmosphere) which warms the surface further, etc. This is a function of the water vapor structure of the atmosphere which is a local issue (more in the tropics, less at higher latitudes). Fussing with MODTRAN would lead a person to some insight into this issue, but a quick calculation leads to an effective emissivity of the present atmosphere treated as a surface coating. This is 0.62. Using this leads to a surface temperature increase of 0.7/0.62=1.2C; thus the 1.2C figure already contains the feedback of the present atmosphere. It’s the additional water vapor feedback that is not yet included and this is a point of general contention.

At any rate, once equilibrium is re-established at TOA, what goes on at the surface is something like an additional 5-6 W/m^2 of new emitted power and this makes Forster’s statement wrong. The ocean will most certainly respond to this enhanced IR irradiance.

ed sebesta
December 21, 2023 10:00 am

Want to hear something really simple. Suppose Atmospheric CO2 concentrations are not even controlled by emissions input. Suppose atmospheric CO2 concentration is controlled a balance between the atmospheric CO2 concentration and the vast ocean sink. This sounds outlandish but data tells me it may well be true. I will be happy to send a write up of my analysis esebesta@comcast.net.

Richard Greene
Reply to  ed sebesta
December 21, 2023 2:01 pm

Warming oceans since 1850, without any manmade CO2 emissions might explain a +17ppm increase of atmospheric CO2

Ocean warming/degassing CO2 emissions can explain none of the CO2 increase since 1850, because approximately +250ppm of manmade CO2 emissions since 1850 explains all +140ppm of the atmospheric CO2 increase since 1850, while nature, including oceans is a net CO2 absorber of about 110ppm.

SteveZ56
December 21, 2023 10:01 am

In reality, the whole idea of a climate sensitivity, defined as a constant change in energy absorbed in W/m2 for a doubling of CO2 concentration in the atmosphere, is contrary to the laws of physics.

Let’s do another thought experiment: imagine that someone had developed a wonderful machine to suck all the CO2 out of the atmosphere and convert it to solid carbon and oxygen gas. According to climate sensitivity theory, if doubling the CO2 concentration increases the energy absorbed by 3.7 W/m2, then halving the CO2 concentration decreases the energy absorbed by 3.7 W/m2.

Starting at 400 ppm, halving to 200 ppm decreases energy by 3.7 W/m2. Halving again to 100 ppm, another 3.7 W/m2 removed, for a total of 7.4 W/m2. Halving again to 50 ppm, another 3.7 W/m2 removed, for a total of 11.1 W/m2. Repeating this process another 5 times brings the CO2 concentration down to 0.78125 ppm, and the total energy removed to 29.6 W/m2. Repeating this process another 20 times brings the CO2 concentration below 1 part per trillion, with an energy decrease of 103.6 W/m2, or nearly 1/3 of the net energy received from the sun.

The problem with climate sensitivity theory is that CO2 in the atmosphere absorbs some of the infrared radiation from earth, and converts it to kinetic energy of molecules expressed as an increased temperature, but removing CO2 from the atmosphere cannot reject any of this energy, but merely fail to absorb it. An atmosphere containing no CO2 cannot reject solar energy back to space, and the water vapor in the atmosphere would continue to absorb IR energy in a CO2-free atmosphere. The energy absorbed by CO2 in a CO2-free atmosphere would be zero, not some very large negative number!

In reality, absorption of infrared radiation by a gas obeys the Beer-Lambert law, where the intensity of the IR radiation passing through the gas is given by

I = Io exp (-aCz) [Equation 1]

where Io = initial intensity at a given wavelength, W/m2
a = absorption coefficient at the same wavelength
C = concentration of gas in molecules / m3
z = distance in meters.

The concentration in molecules / m3 can be calculated from the ideal-gas law:

C = NPy/RT [Equation 2]

where N = Avogadro’s number
P = absolute pressure (Pa)
T = absolute temperature, K
R = ideal gas constant
y = mole fraction absorbing gas (CO2)

Substituting equation 2 into equation 1 results in

I = Io exp (-aNPyz/RT) [Equation 3]

In the atmosphere, both atmospheric pressure P and absolute temperature T decrease with altitude z, but for simplification we will assume that the P/T ratio remains constant. If we define K = NP/RT, Equation 3 can be re-written

I = Io exp (-aKyz) [Equation 4]

If we assume that infrared energy is emitted by the earth at an intensity Io at a given wavelength, then the energy absorbed in the atmosphere at altitude z (in W/m3) is given by

Ea(z) = -dI/dz = Io * aKy * exp (-aKyz) [Equation 5]

As a function of CO2 concentration y, the energy absorbed is the product of a linear term and a decaying exponential term, NOT a ln (y) dependence which would lead to a constant climate sensitivity.

The CO2 absorption spectrum contains some wavelengths with very high absorption coefficients, and other wavelengths where CO2 is nearly transparent, so that the absorption coefficient (a) can vary with wavelength over several orders of magnitude.

If we arbitrarily assume z = 10 meters, we can calculate the ratio of Ea / Io from Equation 5 for various absorption coefficients (expressed as the product aK) and CO2 concentrations of 400, 800, 1600, and 3200 ppm (y = 0.0004, 0.0008, 0.0016, and 0.0032, respectively).

Values of Ea / Io for z = 10m

aK 400 ppm 800 ppm 1600 ppm 3200 ppm

1 0.000398 0.000794 0.001575 0.003099
2 0.000794 0.001575 0.003099 0.006003
5 0.001960 0.003843 0.007385 0.013634
10 0.003843 0.007385 0.013634 0.023237
20 0.007385 0.013634 0.023237 0.033747
50 0.016375 0.026813 0.035946 0.032303
100 0.026813 0.035946 0.032303 0.013044
200 0.035946 0.032303 0.013044 0.001063
500 0.027067 0.007326 0.000268 <.000001
1000 0.007326 0.000268 <.000001 <.000001

Average 0.012791 0.012989 0.013049 0.012613

The values of Ea / Io in the first column (400 ppm) represent the present situation. The maximum absorption occurs for aK = 200 m^-1, then actually decreases for higher absorption coefficients. This means that, for the highest absorbing wavelengths, most of the IR radiation was already absorbed at altitudes below 10 meters, and there is little radiation left to be absorbed at higher altitudes.

The net effect of doubling the current CO2 concentration can be estimated by comparing the columns labeled 400 ppm and 800 ppm. For low absorption coefficients (up to about aK = 50), doubling the CO2 concentration nearly doubles the energy absorbed. The incremental increase reaches a maximum of about Ea / Io = 0.01 between aK = 50 and aK = 100, but for aK > 200, the energy absorbed at 800 ppm is actually less than at 400 ppm.

This means that, at the highest-absorbing wavelengths, most of the available energy is absorbed at lower altitudes (closer to the ground) for higher CO2 concentrations than at lower concentrations. This is the exact opposite of the predictions of the IPCC model, with a high-altitude “hot spot” over the tropics. The Beer-Lambert law would predict the “hot spot” close to the ground with higher CO2 concentrations, with the upper atmosphere becoming slightly colder.

In the table above, the maximum increment in Ea / Io occurs for aK = 50, with an increment of 0.010438 between 400 and 800 ppm. If we multiply this by an assumed IR radiation rate of 340 W/m2, this would come out to a “sensitivity” of 3.55 W/m2 for that value of aK, which agrees closely with Bob Irvine’s assumed value of 3.7 W/m2.

But the absorption coefficients for CO2 across the entire IR spectrum vary widely around this “optimum” value of aK. At lower values of aK, the increase in energy is nearly linear with CO2 concentration, but actual increments in Ea / Io are much lower due to the low absorption coefficients. At higher values of aK, most of the available energy is already absorbed at 400 ppm, with very little additional energy available to be absorbed.

If we take the average value of Ea / Io for the ten values of aK considered (last row), the average increment is 0.000198 from 400 ppm to 800 ppm. Assuming Io = 340 W/m2, this results in a “sensitivity” of about 0.067 W/m2. From 800 to 1600 ppm, the increment in the average Ea/Io is 0.000060, for a “sensitivity” of about 0.021 W/m2. From 1600 to 3200 ppm, this “sensitivity” is actually negative at -0.15 W/m2 per doubling.

The numbers in the table above are approximate, since they were evaluated at only one altitude, and a more accurate model would require integrating over the entire CO2 absorption spectrum, and integrating over all altitudes, taking into account the variation of pressure and temperature with altitude.

However, any model purporting to show an energy increase in the atmosphere due to IR absorption by CO2 must be based on the Beer-Lambert law, and must also take into account “interference” from water vapor, which also absorbs some IR radiation at the same wavelengths as CO2.

The Beer-Lambert law includes a linear term multiplied by a decaying exponential term, where the decaying exponential term dominates at high absorption coefficients and/or CO2 concentrations. This demonstrates the “saturation” effect when nearly all the energy available at a given wavelength is already absorbed at low altitudes, and additional CO2 does not absorb additional energy, establishing an upper bound on the energy absorption and temperature rise.

The “climate sensitivity” concept based on a constant energy increase per doubling is fundamentally flawed and also unbounded, and not based on the laws of physics concerning absorption of IR radiation.

bdgwx
Reply to  SteveZ56
December 21, 2023 10:46 am

Your post is rather large. I’ll only comment regarding halving of CO2 thought experiment. Remember, the canonical 3.7 W/m2 figure for CO2 is confined primarily to the range of CO2 concentrations between 300 and 1000 ppm. Your thought experiment will need to take into account that the sensitivity figure in W/m2 may be much lower once you’ve completed two or more halving or doublings. [Myhre et al. 1998]

Richard Greene
Reply to  bdgwx
December 21, 2023 2:10 pm

I’m really impressed that you read the whole tedious “lecture”.

Richard Greene
Reply to  SteveZ56
December 21, 2023 2:24 pm

This is Piled High and Deep

In 1896 Arrhenius completed a laborious numerical computation which suggested that cutting the amount of CO2 in the atmosphere by half could lower the temperature in Europe some 4-5°C (roughly 7-9°F) — that is, to an ice age level.

He started the logarithmic theory over a century ago which has since been refined by lab spectroscopy with data in the HITRAN ans MODTRAN databases.

Those data are accepted by even 99.9% of “skeptic” scientists, such as William Happer and Richard Lindzen, as a starting point for CO2 ECS estimates.

The different water vapor positive feedback assumptions help cause a large range of ECS guesses … but they are all better than your claptrap claim that there is no ECS of CO2

Tim Gorman
Reply to  Richard Greene
December 22, 2023 3:31 am

but they are all better than your claptrap claim that there is no ECS of CO2″

I don’t believe that is what he is saying.

He says: “The “climate sensitivity” concept based on a constant energy increase per doubling is fundamentally flawed and also unbounded, and not based on the laws of physics concerning absorption of IR radiation.”

Stating the climate sensitivity is based on a constant energy increase per doubling is fundamentally flawed is far from saying that there is no climate sensitivity at all.

The fact that the climate models use a physics that reduces to an unbound value is a big clue that something is wrong with the physics being used. If the theory is wrong, then it is wrong and needs to be redone. It’s just that simple. Remember Feynman.

Tim Gorman
Reply to  SteveZ56
December 22, 2023 3:35 am

Your thought experiment is well formed and internally consistent. It raises issues that need to be addressed by climate science.

But it will fall on deaf ears. Most refutations of what you say will be based on the argumentative fallacy of Argument by Dismissal without providing justification for the dismissal or by the argumentative fallacy of putting words in your mouth. Or even worse, there won’t be any refutation at all, your assertions will just be ignored, just like climate science ignores that averaging distributions with different variances without some kind of treatment makes their averaging dubious at best.

Richard Greene
Reply to  Tim Gorman
December 22, 2023 5:54 am

The estimated ECS of CO2 is determined by lab spectroscopy. The effect is described as logarithmic.

For over a century, scientists have had the opportunity to prove, or at least provide evidence that CO2 is not a greenhouse gas with a logarithmic effect in the atmosphere, unlike in a lab.

THEY HAVE FAILED.

That’s why scientists have a 99.9% consensus there is a greenhouse effect, manmade CO2 is part of it and CO2 has a logarithmic effect. This consensus is based on data.

Argument by Dismissal is claptrap

This is a hypothetical theory coming from some armchair pretend to be a climate scientist guy, hiding behind a moniker, pontificating some unique theory, with some math no one will doublecheck, which is not supported by any experiment or data. Just a hypothetical word salad with a bizarre he’s right unless you can prove him wrong attitude of some fans.

This is actually disagreement based on lab data, aimed at someone who implies that they are right and 99.9% of real climate scientists are wrong about the most basic climate science.

scvblwxq
December 21, 2023 12:16 pm

There was a natural experiment conducted in 2020 when the pandemic hit and countries of the world had lockdowns and people were trying to avoid crowds.

During 2020, human CO2 emissions dropped 6 percent according to the IEA, yet the increases in CO2 continued at the same rate, at least to the eye.
https://www.iea.org/reports/global-energy-review-2020/global-energy-and-co2-emissions-in-2020
https://www.co2.earth/monthly-co2

co2_trend_mlo.png
Richard Greene
Reply to  scvblwxq
December 21, 2023 2:41 pm

CO2 emissions fell 4.6% or 5.4% in 2020, depending on who you believe, not 6%

CO2 also continued rising during the 1973/4 recession and 2008/9 recession too.

Possible reasons:

(1) Inaccurate CO2 level measurements (I doubt it)

(2) Inaccurate CO2 emissions estimates

(3)  The growth in atmospheric concentrations of CO2 was within the normal range of year-to-year variation caused by natural processes.

The “2020 claim” usually leads to a claim that the increase of CO2 since 1850 is mainly natural, which you didn’t say, but that is malarkey.

Ollie
Reply to  Richard Greene
December 21, 2023 4:13 pm

That’s not surprising. Man-made CO2 is a small fraction (estimated to be in the 3-5% range) so a small decrease of a small fraction is pushing the precision envelope.

It is also not surprising as CO2 has not driven temperature in the past so it makes no sense to believe that it suddenly can do so. The oceans emit a large fraction of the natural emissions and that is strongly temperature dependent both in the modern era and before. The fact that CO2 levels follow temperature eliminates it as a cause for increased temperature. If the opposite were true global temperature would have increased 50% or so instead of rising 4% since the late 1800s.

AGW is a hoax but the people at the UN organizations and partners, including WEF and IPCC, use it to further their agenda.

Richard Greene
Reply to  Ollie
December 22, 2023 5:59 am

I was not expecting such a silly reply so fast. Mutiple climate myths in one comment. You are one reason why conservatives get called science deniers … for good reason. You know nothing about climate science.

Manmade CO2 emissions of about +250ppm since 1850

Atmospheric CO2 up +140ppm

That is no coincidence

You are among the 3% to 5% Berry and Harde climate fraud cult dingbats.

Ollie
Reply to  Richard Greene
December 24, 2023 8:51 am

That’s nonsense 3rd grade arithmetic. Assuming +250 is right what is the ppm for natural? How do you get +140 due to manmade? Are you assuming that natural is constant when we know that it is temperature dependent. Are you saying that CO2 sinks preferentially differentiate between natural and manmade and selectively remove 1/2 of the manmade? If so, I’ll guess that you cannot provide any physics or chemistry or data that supports that.

Yes, Berry is right. If you are convinced he is not you should submit a rebuttal.

Ollie
Reply to  Richard Greene
December 21, 2023 4:15 pm

Sorry the response below was for scvblwxq. I clicked the wrong reply button.

Ollie
Reply to  scvblwxq
December 21, 2023 4:17 pm

Repost (hopefully to correct comment.

That’s not surprising. Man-made CO2 is a small fraction (estimated to be in the 3-5% range) so a small decrease of a small fraction is pushing the precision envelope.

It is also not surprising as CO2 has not driven temperature in the past so it makes no sense to believe that it suddenly can do so. The oceans emit a large fraction of the natural emissions and that is strongly temperature dependent both in the modern era and before. The fact that CO2 levels follow temperature eliminates it as a cause for increased temperature. If the opposite were true global temperature would have increased 50% or so instead of rising 4% since the late 1800s.

AGW is a hoax but the people at the UN organizations and partners, including WEF and IPCC, use it to further their agenda.

Richard Greene
Reply to  Ollie
December 22, 2023 6:01 am

Same claptrap repeated again.

If every commenter was like yours this website would be Climate Comedy Central.

RickWill
December 21, 2023 1:38 pm

(perhaps through some cloud change unrelated to any surface temperature response)

This is where the whole concept of GHE falls apart and why it has no bearing on Earth’s energy balance no matter how it is defined.

Clouds closely reflect surface condition. So much so that the ocean surface temperature is regulated to a sustainable maximum of 30C. Only altered by the atmospheric mass.

So Earth’s ocean surface temperature has an upper limit that will be reached if the ToA solar input is 420W/m^2 or higher for a month. Once the solar input reaches that level the atmospheric water will build up resulting in the development of convective potential that regulates the persistence of the clouds to limit surface insolation. Convective instability provides an extraordinarily powerful feedback mechanism.

Mike
December 21, 2023 1:49 pm

Is it possible to simplify the climate sensitivity debate?

Yes it is. There was no warming from 1940 to 2015. Not very sensitive.

Richard Greene
Reply to  Mike
December 22, 2023 6:08 am

YOU statement is a lie.

There was no warming from 1940 to 1975.

There was warming from 1975 to 1979 based on surface data,

In the UAH data there was about +0.7 degrees C. warming from 1979 to 2015 … and a little more warming by the end of 2023,

July 2023 was the hottest month in the UAH dataset since 1979.

Bill Johnston
December 21, 2023 3:08 pm

Dear Bob Irvine,
 
Rather than being a thought experiment, the debate around climate sensitivity seems to be a self-perpetuating game of blind-man’s bluff. At the very heart of the question is whether temperature measured at weather stations is actually increasing vs. whether T-data has been made to be warmer.

 
The second question leading on from that, is whether there is a mechanism that short-circuits what is often portrayed as a flat-earth view of the supposed radiation imbalance – does shortwave radiation minus long-wave emissions at the top of the atmosphere equal zero in the long-term.
 

In relation to the first question, having carefully analysed some 300 of Australia’s maximum temperature datasets using physically-based, objective protocols (BomWatch protocols), I can find no warming (i.e., no temperature increases over time) that is not specifically attributable to site and instrument changes. Data for some stations go back to the 1850s to early 1900s. Furthermore there is ample evidence of data fiddling (homogenisation), as evidenced by, photographs, maps plans etc.  held by The National Library and National Archives of Australia. Examples include Townsville, Queensland, and also Marble Bar in Western Australia (https://www.bomwatch.com.au/data-quality/climate-of-the-great-barrier-reef-queensland-climate-change-at-townsville-abstract-and-case-study/ and https://www.bomwatch.com.au/data-quality/part-2-marble-bar-the-warmest-place-in-australia-2/).

 
If there is no warming that has not been manufactured by the Bureau of Meteorology and other like agencies that use basically the same homogenisation techniques, arguments about climate sensitivity fall to pieces, they are simply one theory vs. another.

 
So where does the energy go; how does it get back to space as radiation?
 

Exemplified by sea surface temperature (SST) measured by the Australian Institute of Marine Science along the Great Barrier Reef, a heat-pump operates in the southern hemisphere between November and March (between the equinoxes) that cools SST north of Latitude 13.5 degS. The heat-pump is the Monsoon, which kicks into gear once SST approaches 30 degC, usually between December and mid-March. This has been explained here by Richard Willoughby (https://www.bomwatch.com.au/bureau-of-meteorology/ocean-surface-temperature-limit/) and also in several posts on WUWT (https://wattsupwiththat.com/2021/05/23/ocean-surface-temperature-limit-part-1/).

The Monsoon removes energy as latent heat from warm pools at the ocean surface and eject it as long-wave radiation from cumulonimbus towers high in the stratosphere, where the clouds condense, eventually to fall as heavy rain (minus embedded heat). This process moves across the equator from north to south and back lagging the sun’s regular progression from Tropic to Tropic.

I’ve shown using AIMS data (Quote) “toward its northern extremity (Bramble Cay, Latitude ‑9.08o, for which there is no useful AIMS data), while SST increases steadily from 01 November to mid-December, from then until March, SST does not exceed between 29o and 30oC. The curvilinear response evidenced an upper-limit to SST, which is rarely or only briefly exceeded.”
 

“Average monthly SST attains a plateau in late November that persists until the cooling phase commences in March. SST in the range 27oC to 29oC from November to late March provides a five-month growing season for corals, which combined with the minimum of around 20oC in July (North Keppel Island) defines the ecotone limit of Reef ecosystems.” And also:
 
“Sea surface temperatures reported by AIMS are no warmer than they were in November and December 150 years ago in 1871. As solar radiation increases in summer, SST north of Latitude -13.5o is cooled by the monsoon and remains in the range of 29oC to 30oC. AIMS SST data shows no evidence that the process has broken-down or is likely to break down in the future.”
 
My question is: If there is no trend in maximum temperature data, and no warming of the tropical ocean, why are talking and debating so-called climate sensitivity, instead of forcing a debate on them?

 
Yours sincerely,

Dr Bill Johnston
http://www.bomwatch,com.au   

Bob Irvine
Reply to  Bill Johnston
December 21, 2023 8:38 pm

I agree Bill. The BOM has some questions to answer.
I did an exercise a few years ago the showed that the magnitude of the change in station temperatures due to the BOMs homogenisation process had a strong correlation with the amount of warming at each individual station.
To my mind, this proved unequivocally that the BOMs homogenisation process has added non climatic warming to Australia’s temp record since 1910.

Richard Greene
Reply to  Bill Johnston
December 22, 2023 6:27 am

Johnston data mining arguments

Australia only
(1.5% of earth’s surface)

All climate change variables

Claims Australia surface temperature number are corrupt

Claims there was no warming of Australia if the if the temperature had been accurately measured in the first place

Implying that what YOU claim for Australia applies to the entire planet

THE IRVINE article

Global average temperatures for 100% of earth’s surface not 1.5%

CO2 only, not every climate change variable

Lab measurements of CO2 as further evidence

Any implication that global warming since 1975 was not real, but was only deliberate or accidental measurement or statistical errors, is COMPLETE CLAPTRAP

Tim Gorman
Reply to  Richard Greene
December 22, 2023 7:22 am

Argumentative fallacy known as Argument by Dismissal. You didn’t actually refute anything Mr. Johnston posted, you just dismissed it as claptrap.

Tim Gorman
Reply to  Bill Johnston
December 22, 2023 7:20 am

+100

sherro01
December 21, 2023 4:15 pm

Bob,
If IR is emitted by CO2 to the oceans, and if the oceans return energy towards space, is that returned energy visible or IR? You claim latent heat of evaporation, that would be mostly visible, would it not? How is the TOA balance restored when the mix of IR and visible changes between incoming and outgoing? Or do you just average out the energy each way irrespective of wavelength composition? That balance calculation is hard if different wavelengths have different residence times. Maybe equilibrium at TOA is not exactly achieved in practise.
The processes of emission, interaction and re-emission can end, it is said, with concepts like photons ending up in space. (But space emits back to Earth, or we would not be able to measure its effective temperature.) You end up with a series with (roughly) half the emissions going down, interacting, re-emitted up, interacting with CO2, emitting, half going down, repeat, repeat. Is this type of mechanism a consideration?
IMO, that number of 3.7 W/sq m for doubling CO2 needs more intensive analysis. It is central to the whole control knob story, but I have not seen it given the third degree. I got part way a few years ago then ran out of brain. Geoff S

Chrism
December 21, 2023 11:25 pm

the energy absorbed in oceans from solar radiation is heating deeper water (than CO2) which thus causes a more delayed heating response (than CO2 IR)

such deeper water heating is likely to alter mixing rates with deeper waters and with high latitude waters; and will increase water vapour, particularly in tropics, possibly with a negative feedback on solar input via increased clouds

I can’t imagine the differential equations required to solve these flows but suspect clouds are the ghost in the machine

Jim Karlock
December 22, 2023 3:09 am

Let me try to further simplify the logic:
1.Measurements show that CO2 increases FOLLOW temperature increases.
2.Same for decreases.
3.Same for all timescales.
4.A cause CANNOT FOLLOW ITS EFFECT.
Therefore CO2 has zero effect on climate.
Thanks
JK

Richard Greene
Reply to  Jim Karlock
December 22, 2023 6:33 am

.”Measurements show that CO2 increases FOLLOW temperature increases.”

Measurements do not show that

Climate proxies show ocean CO2 reacts to changes in ocean temperatures. The process is small and slow

Measurements show adding manmade CO2 to the atmosphere impedes earth’s ability to cool itself, causing a higher average temperature mainly affecting night lows (TMIN)

Your claims are bassackwards.

Jim Karlock
Reply to  Richard Greene
December 22, 2023 4:16 pm

My collection shows that CO2 follows temperature. Even the CRU climate criminals admit this on Realclimate.org.
CO2 FOLLOWS temperature, thus it cannot cause temperature rise
On Hens, Eggs, Temperatures and CO2: Causal Links in Earth’s Atmosphere–https://www.mdpi.com/2413-4155/5/3/35
————
Coherence established between atmospheric carbon dioxide and global temperature
Abstract
The hypothesis that the increase in atmospheric carbon dioxide is related to observable changes in the climate is tested using modern methods of time-series analysis. The results confirm that average global temperature is increasing, and that temperature and atmospheric carbon dioxide are significantly correlated over the past thirty years. Changes in carbon dioxide content lag those in temperature by five months. https://www.nature.com/articles/343709a0
————–
CO2 FOLLOWS temperature https://judithcurry.com/2023/09/26/causality-and-climate/
————-
http://www.debunkingclimate.com/co2climate.html\
http://www.debunkingclimate.com/CO2_lags.html
http://www.debunkingclimate.com/VostokGraph.html#800years
https://www.c3headlines.com/2022/09/joe-biden-democrats-climate-doomsday-extremists-who-ignore-noaas-real-world-evidence.html
A little off topic:
https://notrickszone.com/2022/01/13/nearly-140-scientific-papers-detail-the-minuscule-effect-co2-has-on-earths-temperature/

http://www.debunkingclimate.com/co2_facts.html
———–
https://search.aol.co.uk/click/_ylt=Awr.gk_Xj21lZR0vN.kECmVH;_ylu=Y29sbwNpcjIEcG9zAzEEdnRpZAMEc2VjA3Ny/RV=2/RE=1701707864/RO=10/RU=https%3a%2f%2fedberry.com%2fwp-content%2fuploads%2fCourtney_NY_2008.pdf/RK=0/RS=0k0EB6KQatFXGQiBl.jMaJEHbPg- In which, in year 2008, I explained this finding of Rorsch, Courtney & Thoenes published in the formal literature in 2005 that says,
“In the light of all the above considerations it would appear that the relatively large increase of CO2 concentration in the atmosphere in the twentieth century (some 30%) is likely to have been caused by the increased mean temperature that preceded it. The main cause may be desorption from the oceans. The observed time lag of half a century is not surprising.”

Bruce Cobb
December 22, 2023 4:52 am

Theory can be fun, I guess. Meanwhile, back in the real world, we know that a good part of the so-called “warming” is likely due to a faulty temperature record. Much of the remaining warming is likely simply a natural recovery from the LIA. Some small, indeterminate amount of warming is likely due to the increase in CO2. Whatever that small amount is though, is both impossible to measure as well as inconsequential. Natural forces can easily negate it.

MiltonG
December 22, 2023 5:11 am

Seems like just another example of pulling a number from one’s posterior: “I am proposing”.

Meanwhile, no mention of Stephen Botzman’s law for blackbody radiation (a warm body radiates a LOT more energy—4th pawer impact) or Wein’s law for soectral displacement. Not a breath about the logarithmic decay of the impact for marginal increases in CO2 concentration. And all while exploiting the reputational authority of Albert Einstein.

MacNeil
December 22, 2023 8:36 am

I haven’t heard of David’s Law and nor has Google.
The residency time for energy in silver or black ball is the same time as it is illuminated, once it has attained equilibrium. This can be infinite. At equilibrium, one watt incoming is matched by one watt outgoing. The outgoing cannot deviate from that unless the incoming varies.

Bob Irvine
Reply to  MacNeil
December 23, 2023 5:45 pm

Mac
We are talking here about an incremental change in input. The black ball will take longer to reattain equilibrium and consequently will warm more in its centre.
Even at equilibrium the input energy will be absorbed on average deeper within the black ball and remain in the ball for longer.
Assuming there is no atmosphere the surface of the balls will be the same temperature but the black ball will feel hotter due to higher conductivity. At least that is how I see it.

Crispin in Val Quentin
December 22, 2023 6:11 pm

Bob

Sorry for the long delay in writing this but I needed time to think about it.

I was impressed to read that you are describing water heating by insolation but did not describe it as that specifically. What you described is insolation heating the water in the same way the land is.

The relevances are multiple so I have to think about all the implications. The black ball/silver ball analogy, to me, fails conceptually because there is convection heat transfer at the surface and with any value of convection heat transfer to the balls (at all) the black ball is going to be cooler as it has a greater ability to radiate energy.

The problem I have with your thesis in toto is that warming of the atmosphere “at the surface” meaning at 2 m altitude, is there are two contributors to the raising of the temperature which are conventional GHG radiation and absorption plus heat convection from hot surfaces or to cold surfaces.

Insolation being absorbed by the oceans you have observed but it is explained that the water cools by evaporation and that sends water vapour into the air as a GHG, but there is no mention of the heat transferred by contact. You captured the IR physics well and the visible light, but there is heat transfer to the air by contact.

When looking at land the convection is far more pronounced: insolation heats the surface, depending on its emissivity, and there is massive heat transfer to the air that does not involve radiation. In short there are two distinct mechanisms heating the air at the surface: radiation captured incoming and outgoing and convective heat transfer from the surface.

It is postulated that increasing insolation by some Watt per sq m will have this and that effect but convective heat transfer from the surface to the air is not mentioned. Why?

So I had a squizz at some numbers to get a grip on the magnitudes. Incoming insolation reaching the surface is about half what it would be without any GHGs at all. If it increased by one Watt, half a Watt extra would reach the surface, of which a portion would heat the air by contact. It doesn’t matter for the moment what the % is. The argument presented deals only with radiation + ocean warming but not land warming. I think this omission matters.

How to demonstrate that?

Suppose GHGs were greatly reduced or increased – what would happen to the air temperature? According to the radiation promoters, the temperature would go up and up with the claim that we would become “Venus”, ignoring the fact that at 1 atmosphere depth and 95% CO2 the temperature is the same as Earth now at 0.04%. So that claim makes no sense – at all. Something else is going on.

If we go the other way, reducing the concentration to a low value, what do we find? The emissivity of the atmosphere would plummet (turning the black ball into a silver ball), the insolation reaching the surface would double, and the convection to the air directly would similarly double.

As described above, the incoming radiation absorbed by the atmosphere would tend to zero, the capture of IR from the surface by the atmosphere would tend to zero (no receivers), and the cooling capacity of the atmosphere would similarly drop due to an absence of GHGs.

This is the part that is missing from the usual descriptions: the heating of air by the surface would continue at twice the previous rate, and whatever energy was left, would be lost by radiation to the sky (from the surface).

So how does the heated air, which would do a really good job taking heat energy from the hot surface, be lost to space? This heating process would definitely continue because it is part and parcel of the pair of contributions to the air temperature – as you have implied using the water-absorbed insolation.

With low GHG concentration and high convection to the air, what is the mechanism for cooling the atmosphere if it cannot cool by radiation? And what would the air temperature be?

I suggest that as it is unable to cool effectively by radiation the main mechanism will be by convective heat transfer to the surface at night. The surface would be cooling by radiation at night and eventually be cooler than the air, so the air would lose heat to the surface whereupon it would be radiated to space. At some point the system would be in equilibrium. What would the air temperature be at that time? Certainly above 100 C.

If greatly increasing the GHG concentration provides nearly no increase in the air temperature and greatly reducing the concentration provides a rapid increase in air temperature, there is a fundamental flaw in the idea that all warming above -18 C is due to GHGs and also that doubling the CO2 concentration will create radiative changes alone. Increased insolation would not create radiative changes alone.

Your proposal that we consider a change in insolation of 5 W/m^2 creates a useful case to explore. However any analysis must consider convection AND radiation if we are trying to predict the air temperature because such a change would affect both contributors.

I invite you to contact me directly and copy Kip Hanson as we have been discussing some of this off-list. The explanation provided by the IPCC (and many others) is fundamentally flawed. Full stop. The surface temperature of the moon with no atmosphere has no relevance to the air temperature of the Earth with and without GHGs.

Sincerely
Crispin, actually in Tucson

Bob Irvine
Reply to  Crispin in Val Quentin
December 22, 2023 6:59 pm

Hi Crispin
I’m flat out with the grandkids today. I hope to give you a detailed reply tomorrow morning. Regards

Bob Irvine
Reply to  Crispin in Val Quentin
December 24, 2023 4:01 pm

Hi Crispin
Interesting approach.
To my way of thinking as GHGs are removed the emission height is lowered and eventually the surface or close to it becomes the emission height at 255 C. The average emission height is always the same temperature and in this situation the surface would be close to a black body and lose energy almost entirely by radiation. The surface would be cold and convection would be minimal.
It’s food for thought. I could easily be wrong as these are difficult issues.

Either way energy residence time in the system is a good way to summarise the effect of any forcing change. It works with your analogy and with mine.
The IPCCs approach is that if a forcing acts in the upper atmosphere it will typically have low efficacy as TOA equilibrium is attained relatively quickly.
Residence time is minimal.
If on the other hand a forcing acts on the poles then energy transport from the tropics will be slowed, increasing energy residence time and consequently this forcing will have high efficacy.
That solar energy has a higher residence time than energy remitted by CO2 to me is hard to argue with. It follows that solar changes will have larger effect the earths climate particularly average temperature.
In our current state I think the convection has a huge influence and is likely a large negative feedback to any warming.
To some extent the earths atmosphere is a massive heat engine. When input energy is increased the energy moves more quickly through the system. A hugely important negative feedback.
Have a good Xmas

%d
Verified by MonsterInsights